
PUBLIC JWST IMAGING
Little red dots.
The search is ongoing.
Little red dots are compact, red sources seen by the James Webb Space Telescope. Their ancient light may reveal how black holes grew in the young universe.
I’m independently measuring compact red sources in public Webb images, testing two selection routes, and comparing the candidates with published catalogs.
LRD Watch DR1: dataset, methods & citation → · doi:10.5281/zenodo.23062632
New to Webb and little red dots? Start here
What is Webb, and why can it see them? Webb is a large telescope in space, also called JWST. As the universe expands, light traveling from distant galaxies stretches to longer wavelengths, into infrared. Webb’s large mirror collects that faint light, and its sensitive infrared cameras record it.
Why does looking far away mean looking back in time? Light takes time to travel. When light reaches us after billions of years, it shows the object as it was billions of years ago. Webb collects that old light, giving us a view of the young universe. How Webb sees the distant past ↗
Why “little”? They look tiny on the sky, even to Webb. The name describes their appearance; it does not tell us what is inside. Astronomers often shorten it to LRDs.
Why red? Webb detects infrared light, which our eyes cannot see. Images translate those measurements into visible colors, usually assigning red to longer wavelengths. These objects are especially bright in some of those longer-wavelength views. The colors reveal differences in their light; they are not a naked-eye view.
What could be shining? One explanation is hot gas around a growing black hole, hidden inside a dense cloud. Stars and dust can also contribute. Astronomers are still working out which explanations fit which dots, and whether they all belong to the same family.
Further reading: NASA’s introduction to little red dots and what recent observations suggest.
Why I follow the light
I first encountered the Hubble Deep Field as a child. This project continues the same act: choose a point in the darkness, follow its light, and see what the universe is willing to tell us.
Choose a dot. Follow its light.
Published reference
MoM-BH*-1
Field width
 ≈ 0.5° · separate reference
Why these colors?
All three filters record invisible infrared light. Display colors distinguish their wavelengths.
Wavelengths are given in micrometers (μm).
Curated destinations
31 prepared journeys from the September 17 evidence snapshot. Open a source’s info card for its current map category.
Potential BH* = a possible black-hole star, not a confirmed identification.
What makes this a potential BH*?
A black-hole star is a proposed black hole surrounded by a glowing gas atmosphere. This source was selected by fitting that kind of model to its measured light, then checking the images. Selection checked 17 September 2026.
See this source in three infrared filters
Evidence & limits for this source
In cluster fields, a compact red source may be a foreground member or blended with cluster-galaxy light. The image alone does not establish its distance; separate lensed images remain separate picks.
Image evidence: 13 September 2026 for the original journeys; 17 September for six additions and highlighted BH* checks. Earlier images have not been refreshed. These examples are not ranked discoveries. A photometric little-red-dot label can include different physical kinds of source.
 ▶ Play narrated sky journey
Each interactive zoom takes 30 seconds. The gold marker locates the source; change destinations at any zoom level.
Think of a one-watt light on the Moon. From Earth, that would be roughly as faint as MoM-BH*-1, using the atmosphere model.
Now put a 3 mm speck beside it. The model’s glowing surface, about 1,600 AU across, would look about that small. Webb detects the light, but cannot make out the surface.
Read the narrated MoM journey
Our destination lies in Cetus. This sky mosaic joins photographs from Palomar's Schmidt telescope in California and the UK Schmidt telescope in Australia.
The surveys photographed different patches on separate nights, from the nineteen seventies through nineties, usually about an hour per exposure. Red and blue photographs provide the colors; green is blended.
The Moon, photographed by Galileo in nineteen ninety-two, is a separate size reference.
Next, Hawaii's Pan-STARRS One, combining visits from twenty-ten to twenty-fourteen. Visible green light is displayed as blue, and near-infrared light as red.
Now Webb's Near Infrared Camera, using images taken in twenty twenty-three. Cosmic expansion stretched the dot's ultraviolet and visible light into infrared, beyond human vision.
The three Webb filters measure infrared light. We display the shortest wavelengths in blue, the middle band in green, and the longest in red. The dot stands out in red because its longer-wavelength signal is stronger.
Its modeled brightness, across all wavelengths, is like a light on the Moon emitting one watt in all directions.
That model's glowing surface is about sixteen hundred astronomical units across. At this distance, it would look as small as a three-millimeter speck on the Moon.
Webb detects the light. The proposed surface is far too small to resolve.
Telescopes, dates & image processing
Survey photographs and observation dates
The opening DSS mosaic joins photographs of different sky patches taken on separate nights. CDS gives 1975–1999 as the date range of the survey collection. Individual photographic exposures usually lasted 40–70 minutes; some special plates had shorter exposures. The date range describes the archive, not time accumulated on this field.
The Pan-STARRS1 image combines repeated visits from its 2010–2014 survey. The film’s Webb / PRIMER mosaics include January 2023 observations; its final archive cutouts include August 2023 observations. These are dates of contributing observations, rather than one exposure date for the whole mosaic.
Scale, filters and missing coverage
Each incoming telescope image appears at its actual angular footprint, aligned with the outgoing sky. Every telescope handoff keeps both images aligned and visible through a gradual fade. The deeper optical view fades in from an 18-arcminute field width to 3.6 arcminutes; DSS remains visible as it fills the frame at 7.2 arcminutes. Webb uses the same transition from 90 arcseconds to 18 arcseconds, retaining optical context at 36 arcseconds. The deeper optical images come from Pan-STARRS1, or DECam / Legacy Surveys DR10 for southern destinations outside Pan-STARRS1 coverage. The BDF field uses a single visible-light g-band image in grayscale because its optical color coverage is incomplete. NEXUS uses F356W for green in place of F277W. COSMOS · 39030 uses F277W, F356W and F444W because shorter-band coverage near the source is incomplete. Missing coverage is left empty; these gaps do not show an absence of objects. The last view uses nearest-neighbor sampling at the original pixel scale, with no generated detail. Color composites retain the different telescope point-spread functions; they should not be read as resolved internal structure.
Image products and filter provenance ↗
The opening guide labels constellation regions and cataloged stars and objects, including Aldebaran, Rigel, Mira, the Pleiades and Orion Nebula. Positions come from CDS/SIMBAD; constellation names follow IAU sky regions.
Display adjustments
Brightness, color and sky background are adjusted for display. Background leveling reduces seams in the opening mosaic and can alter faint diffuse light; use the original survey data for scientific measurements.
All astronomical images come from telescope or spacecraft cameras. Webb composites follow the shorter-to-blue, longer-to-red convention; the legend identifies each destination’s filters. Different filters and contrast stretches prevent calibrated color comparisons across journeys. The animation changes angular scale, not distance through space.
Optical sky: DSS / Oschin and UK Schmidt telescopes / STScI / NASA / CDS and Pan-STARRS1 / PS1 Science Consortium / MAST / CDS. Infrared images: JWST / PRIMER, NGDEEP and UNCOVER / Dawn JWST Archive; NEXUS / JWST programs 5105 and 9263. Moon: Galileo PIA00405 / NASA / JPL / USGS, an enhanced-color photograph used only as a labeled angular-size reference.
Download the journey images & provenance
Download the 31 journey examples · ZIP, 65.8 MB · 2026-09-17. Includes display images, filter provenance, source notes and checksums, with an offline image browser. Download details and SHA-256.
How the Moon comparisons are calculated
The Moon comparisons use the Naidu et al. atmosphere model luminosity of 10^44.5 erg/s, an illustrative 7,500 K blackbody and Planck18 cosmology at redshift 7.7569. “One watt” means light emitted in all directions across all wavelengths. At the Moon’s mean distance of 384,400 km, the calculated equivalents are 0.78 watts and 2.85 mm.
The images constrain the half-light radius, the radius enclosing half the source’s light, to less than 117 parsecs at 99% confidence. The proposed 1,600 AU diameter is an illustrative model scale; the surface itself is unresolved.
Where the dots are
Select two or more layers to overlay.
ONE SKY · THREE PERSPECTIVES
Compare the populations
Selection stages
One stage per object. Selection is not confirmation.
All layers use the same coordinates and scale.
Counting & comparison limits
Symbols mark catalog positions, not telescope images. Colors and shapes distinguish samples and selection stages; marker size is not source size.
Positions are grouped within each sample at one arcsecond. An object can appear in several samples, so their counts cannot be added into a unique total. Overlapping symbols alone do not establish a match.
Layers share a coordinate grid and scale. Regions are display windows, not survey footprints, and some windows overlap. A blank layer means no catalog entries in this window, not that a telescope observed it and found nothing. Different selections, depths and redshift ranges limit comparisons between samples.
Snapshot: 2026-10-16. Select a single layer for its category breakdown and methods.
Candidates & recoveries
Snapshot · 2026-10-16.
Includes uncertain candidates and known objects recovered independently. Selection is not confirmation. Methods & limits ↓
Regions represented in this output
These regions contain returned objects. This is not an observing footprint or a list of every searched field; searches with no returned objects are absent.
- PANORAMIC J021824-0517 · 6 field datasets
- COSMOS · 9 field datasets
- GOODS-S (JADES Medium/HST F6 repeat) · 25 field datasets
- EGS · 17 field datasets
- GOODS-N · 8 field datasets
- NEXUS · 3 field datasets
- NEP-TDF (PEARLS) · 5 field datasets
- POPPIES pointing 95 · 1 field dataset
- Abell 2744 (UNCOVER) · 3 field datasets
- PANORAMIC J125652+5652 · 1 field dataset
- PANORAMIC J153500+2325 · 1 field dataset
- MACS J0416.1-2403 · 5 field datasets
- POPPIES pointing 02 · 1 field dataset
- RA 64.66° Dec -47.87° · 1 field dataset
- PLCK G165.7+67.0 · 3 field datasets
- PANORAMIC J021728-0214 · 2 field datasets
- PANORAMIC J031404-1759 · 1 field dataset
- PANORAMIC J224604-0518 · 2 field datasets
- Abell 370 · 3 field datasets
- PANORAMIC J221648+0025 · 2 field datasets
- MS 0451.6-0305 · 1 field dataset
- POPPIES 01 · 1 field dataset
- MACS J1423.8+2404 · 2 field datasets
- RXC J0032.1+1808 · 1 field dataset
- PANORAMIC J013900-1019 · 1 field dataset
- PANORAMIC J014428+1715 · 1 field dataset
- PLCK G191.24+62.04 · 1 field dataset
- PLCK G171.9-40.7 · 1 field dataset
- PANORAMIC J142536+5630 · 1 field dataset
- GAMA-100033 · 1 field dataset
- Abell 68 · 1 field dataset
- CL J0152.7-1357 · 1 field dataset
- PANORAMIC J094232+0923 · 1 field dataset
- MACS J1149.5+2223 · 2 field datasets
- RXC J0600.1-2007 · 3 field datasets
- MACS J0417.5-1154 · 2 field datasets
- SDSS J0129-0035 · 1 field dataset
- PJ0846+15 · 1 field dataset
- ClG J1212+2733 · 1 field dataset
- MACS J0025.4-1222 · 2 field datasets
- SMACS J0723.3-7327 · 2 field datasets
- POPPIES 03 · 1 field dataset
- SGAS J1050+0017 · 1 field dataset
- SPT-CL J2325-4111 · 1 field dataset
- El Gordo (ACT-CL J0102-4915) · 2 field datasets
- RA 160.45° Dec +58.76° · 1 field dataset
- SPT-CL J0615-5746 · 2 field datasets
- RXC J0018.5+1626 · 2 field datasets
- POPPIES pointing 105 · 1 field dataset
- RXC J2211.7-0350 · 1 field dataset
- Abell S1063 · 2 field datasets
- WHL0137-08 · 2 field datasets
- MACS J1931.8-2635 · 2 field datasets
- MACS J0257.6-2209 · 1 field dataset
- Abell 3192 · 1 field dataset
- Abell S295 · 1 field dataset
- BDF-3299 · 1 field dataset
- SGAS J1110+6459 · 1 field dataset
- PANORAMIC J043844-6849 · 1 field dataset
- Abell 2537 · 1 field dataset
- Abell 383 · 1 field dataset
- Abell 209 · 1 field dataset
- Bullet Cluster (1E 0657-56) · 4 field datasets
- MACS J0308.9+2645 · 1 field dataset
- PLCK G004.5-19.5 · 1 field dataset
- PANORAMIC J000352-1120 · 1 field dataset
- RXC J0911.1+1746 · 1 field dataset
- MACS J0940.9+0744 · 1 field dataset
- PANORAMIC J131432+2432 · 1 field dataset
- MACS J1206.2-0847 · 1 field dataset
- PANORAMIC J130016+1215 · 1 field dataset
- RXC J0232.2-4420 · 1 field dataset
- Abell 2813 · 1 field dataset
- MACS J0329.6-0211 · 1 field dataset
- POPPIES 02 · 1 field dataset
- PANORAMIC J100736+2109 · 1 field dataset
- PANORAMIC J093144+0819 · 1 field dataset
- MACS J2214.9-1359 · 1 field dataset
- MACS J0257.1-2325 · 1 field dataset
- PANORAMIC J013748-2152 · 2 field datasets
- MACS J0159.8-0849 · 1 field dataset
- PANORAMIC J013444-1532 · 1 field dataset
- RA 260.93° Dec +34.20° · 1 field dataset
- PANORAMIC J134348+5549 · 1 field dataset
- PANORAMIC J144904-1017 · 1 field dataset
- SGAS J1429+1202 · 1 field dataset
- POPPIES pointing 120 · 1 field dataset
- MACS J1311.0-0310 · 1 field dataset
- RA 83.99° Dec -69.18° · 1 field dataset
- MACS J2129.4-0741 · 1 field dataset
- SDSS J2054-0005 · 1 field dataset
- PANORAMIC J010408-5508 · 1 field dataset
- MACS J0035.4-2015 · 1 field dataset
- MACS J1115.9+0129 · 1 field dataset
- PANORAMIC J121932+0330 · 1 field dataset
- MACS J0647.8+7015 · 1 field dataset
- MACS J0717.5+3745 · 1 field dataset
- PANORAMIC J170720+5853 · 1 field dataset
- Abell 1689 · 1 field dataset
- RA 200.94° Dec +27.56° · 1 field dataset
- MACS J0553.4-3342 · 1 field dataset
- Abell 521 · 1 field dataset
- MACS J0429.6-0253 · 1 field dataset
- PANORAMIC J123140-1618 · 1 field dataset
- SGAS J1226+2152 · 1 field dataset
- Cosmic Eye · 1 field dataset
- PANORAMIC J234512-4235 · 1 field dataset
- SMACS J2131.1-4019 · 1 field dataset
- POPPIES pointing 121 · 1 field dataset
- MS 2137.3-2353 · 1 field dataset
- SGAS J2111-0114 · 1 field dataset
- RX J2129.7+0005 · 1 field dataset
- RX J1532.9+3021 · 1 field dataset
- MACS J0451.9+0006 · 1 field dataset
- SMACS J2031.8-4036 · 1 field dataset
- POPPIES 09 · 1 field dataset
- RA 231.95° Dec +6.89° · 1 field dataset
- POPPIES 10 · 1 field dataset
- PLCKG287+32.9 · 1 field dataset
- POPPIES 04 · 1 field dataset
- RA 38.92° Dec -5.56° · 1 field dataset
- RA 182.93° Dec -1.32° · 1 field dataset
See the whole sky
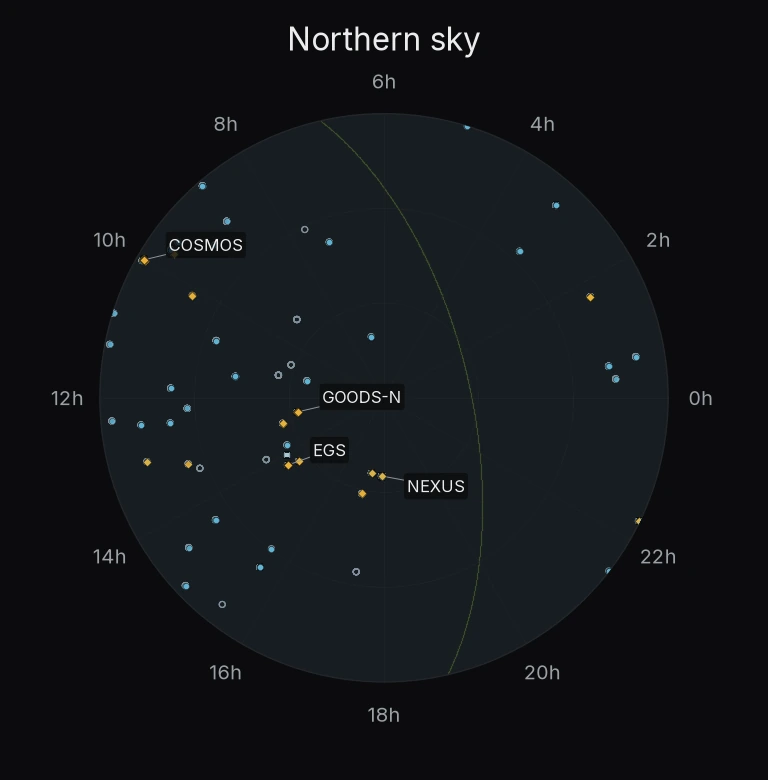
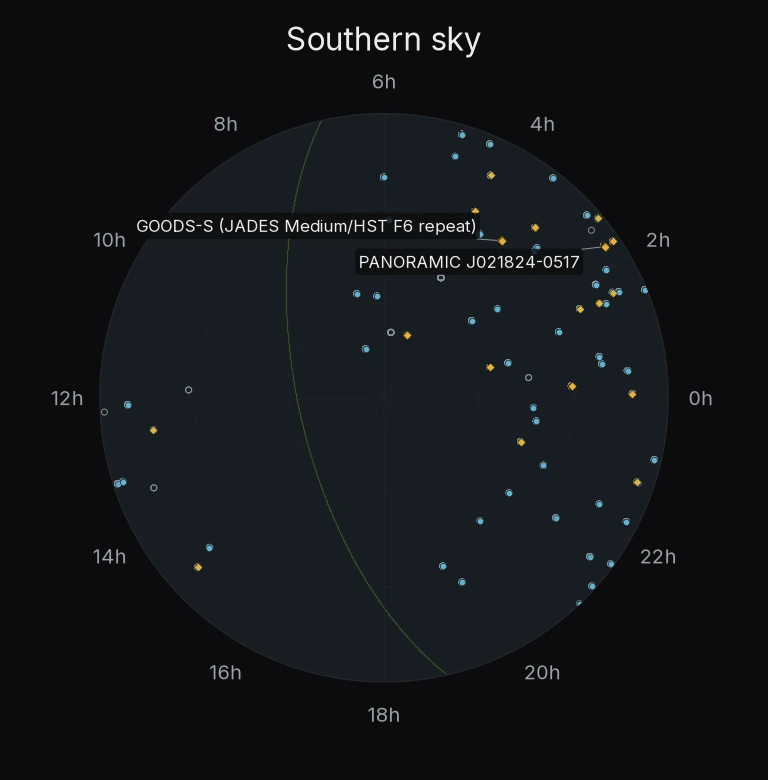
- Watch list2,958
- BH* selection below redshift 369
- Selected after vetting790
- Recovered in published JWST catalogs449
Every plotted position is shown. Rings mark 30° and 60° from the pole; the muted green arc is the Galactic plane. These are source maps, not survey footprints.
REGION 1 OF 122
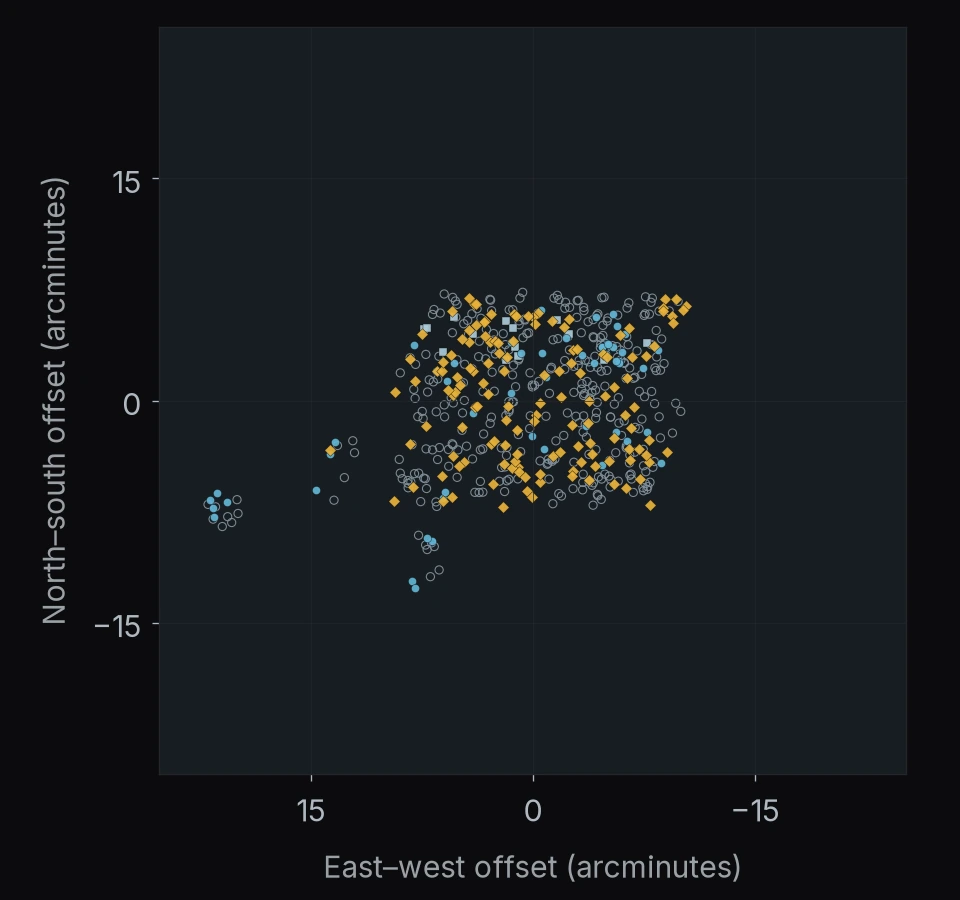
PANORAMIC J021824-0517
549 objects
- Watch list347
- BH* selection below redshift 314
- Selected after vetting52
- Recovered in published JWST catalogs136
North is up · east is left.
Axes show angular offsets from the region center.
REGION 1 OF 122
PANORAMIC J021824-0517
549 objects
- Watch list347
- BH* selection below redshift 314
- Selected after vetting52
- Recovered in published JWST catalogs136
North is up · east is left.
Axes show angular offsets from the region center.
REGION 2 OF 122
COSMOS
512 objects
- Watch list330
- BH* selection below redshift 316
- Selected after vetting61
- Recovered in published JWST catalogs105
North is up · east is left.
Axes show angular offsets from the region center.
REGION 3 OF 122
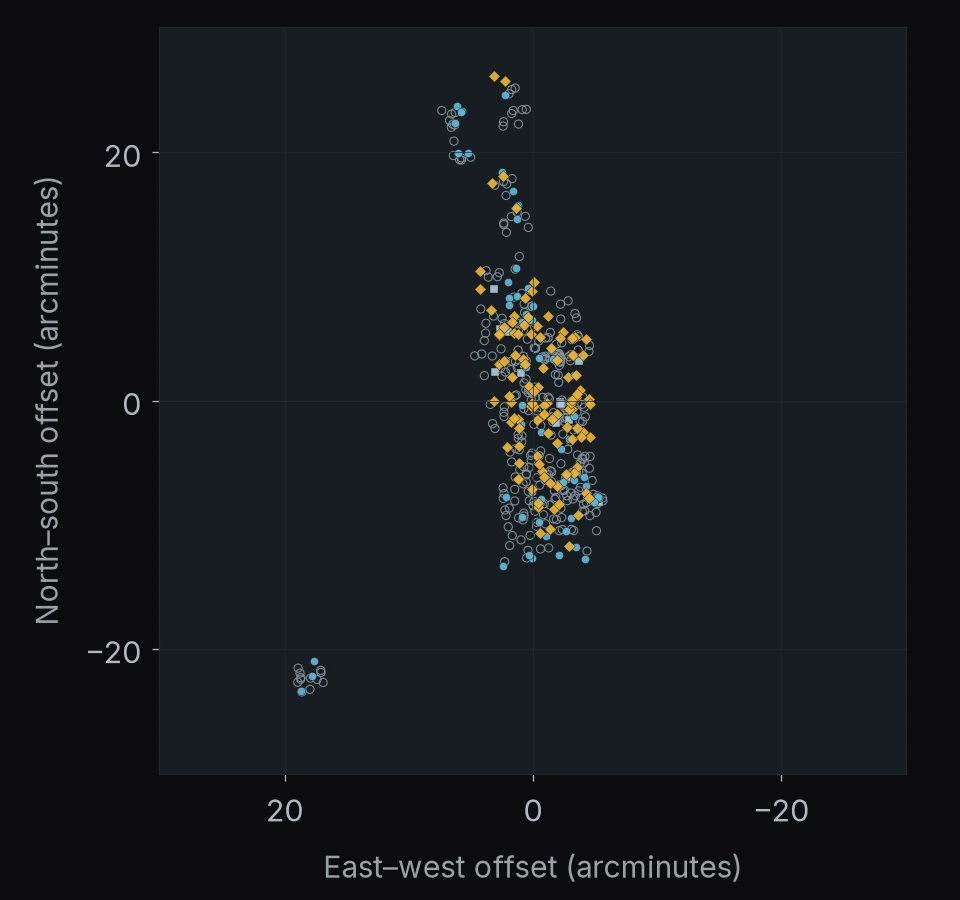
GOODS-S (JADES Medium/HST F6 repeat)
327 objects
- Watch list205
- BH* selection below redshift 37
- Selected after vetting61
- Recovered in published JWST catalogs54
North is up · east is left.
Axes show angular offsets from the region center.
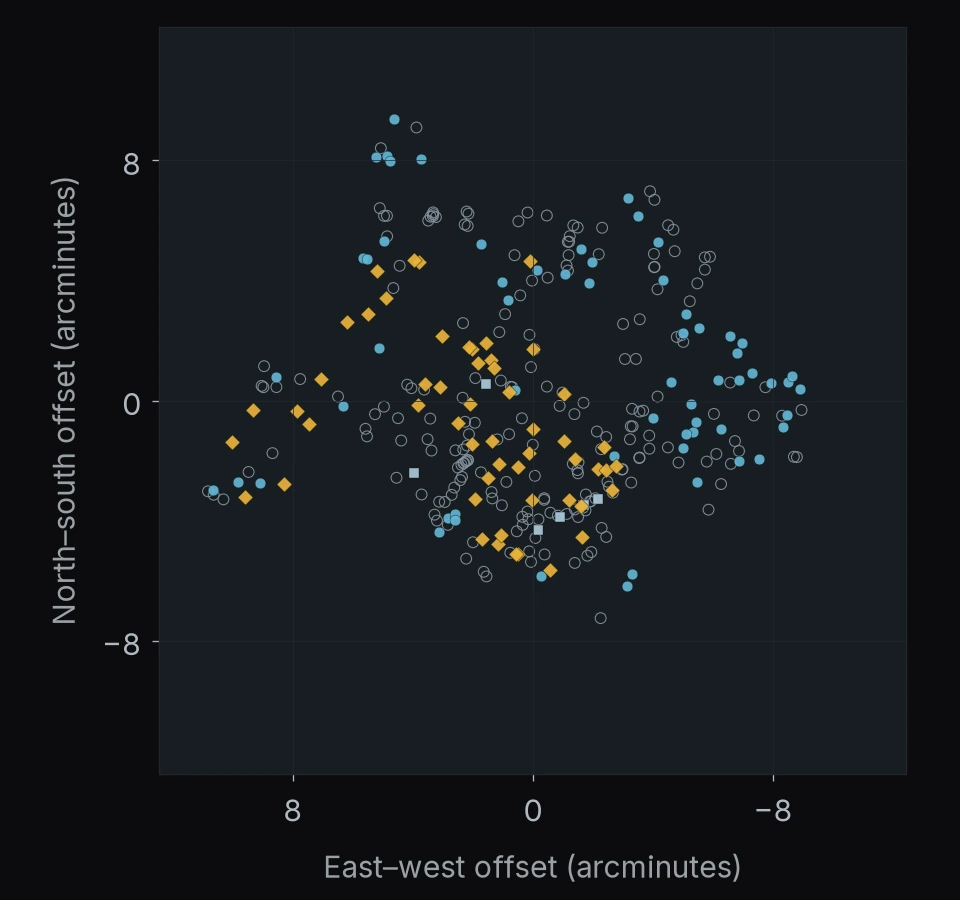
REGION 4 OF 122
EGS
277 objects
- Watch list182
- BH* selection below redshift 34
- Selected after vetting47
- Recovered in published JWST catalogs44
North is up · east is left.
Axes show angular offsets from the region center.
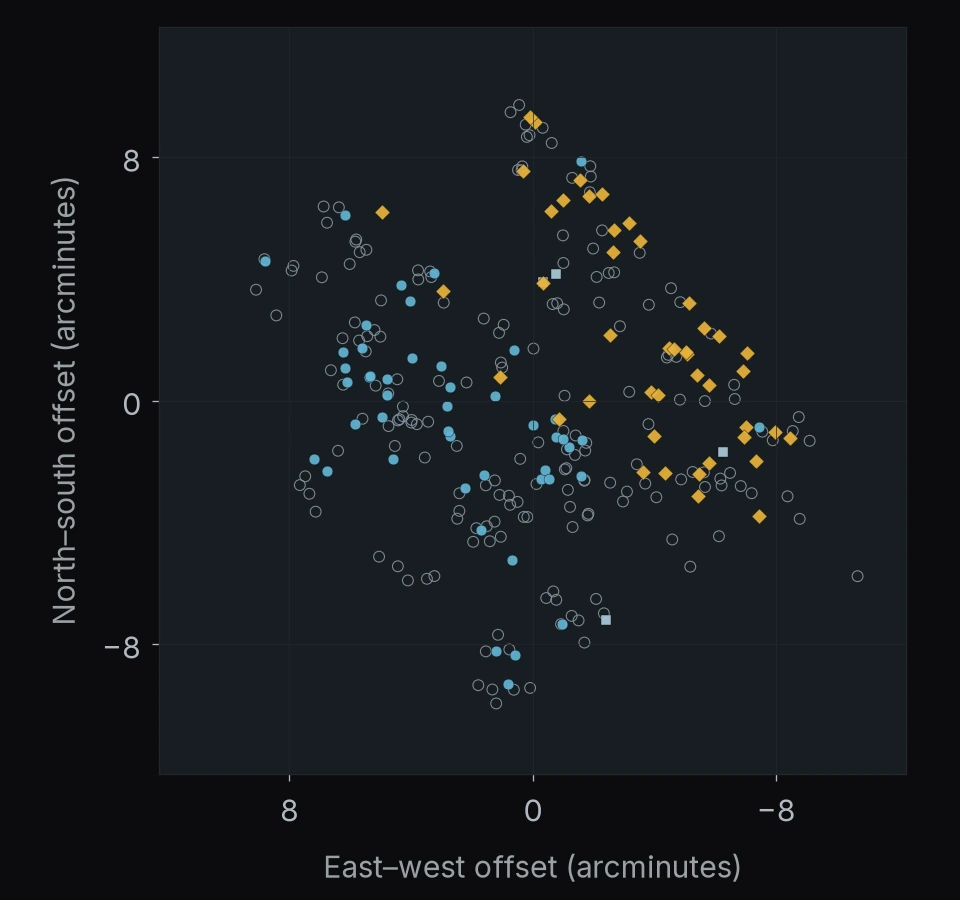
REGION 5 OF 122
GOODS-N
221 objects
- Watch list152
- BH* selection below redshift 33
- Selected after vetting37
- Recovered in published JWST catalogs29
North is up · east is left.
Axes show angular offsets from the region center.
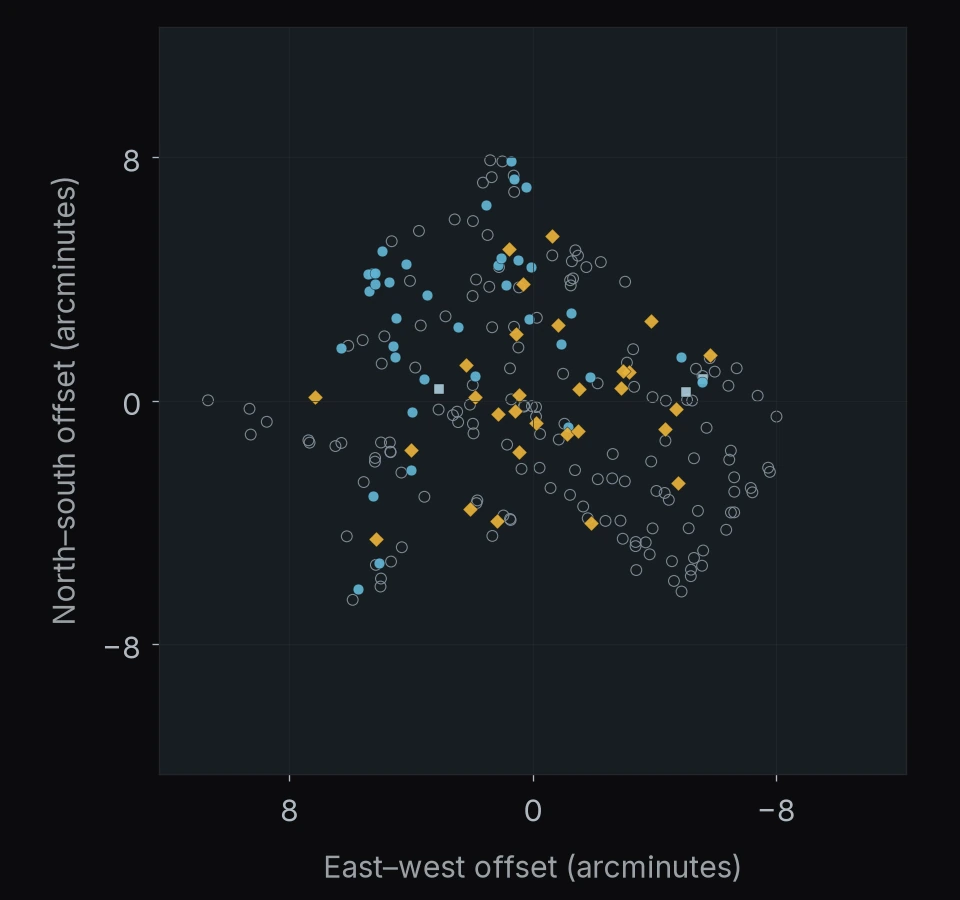
REGION 6 OF 122
NEXUS
200 objects
- Watch list162
- BH* selection below redshift 38
- Selected after vetting29
- Recovered in published JWST catalogs1
North is up · east is left.
Axes show angular offsets from the region center.
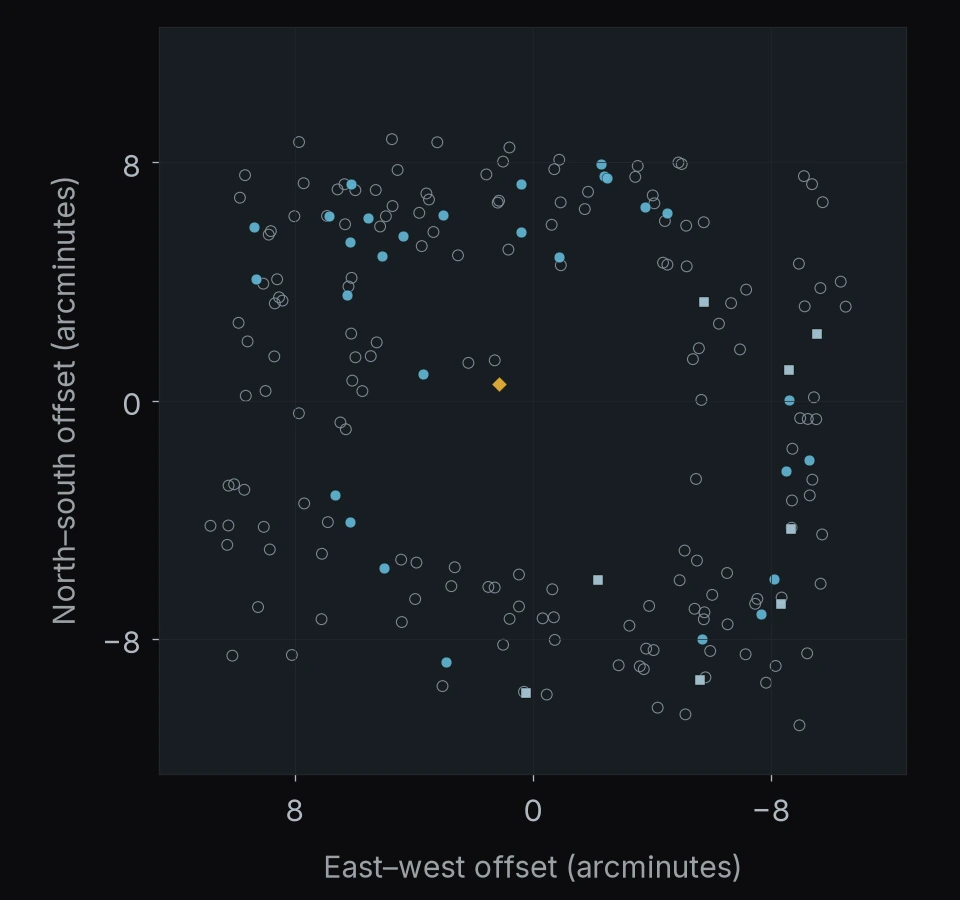
REGION 7 OF 122
NEP-TDF (PEARLS)
139 objects
- Watch list97
- BH* selection below redshift 31
- Selected after vetting40
- Recovered in published JWST catalogs1
North is up · east is left.
Axes show angular offsets from the region center.
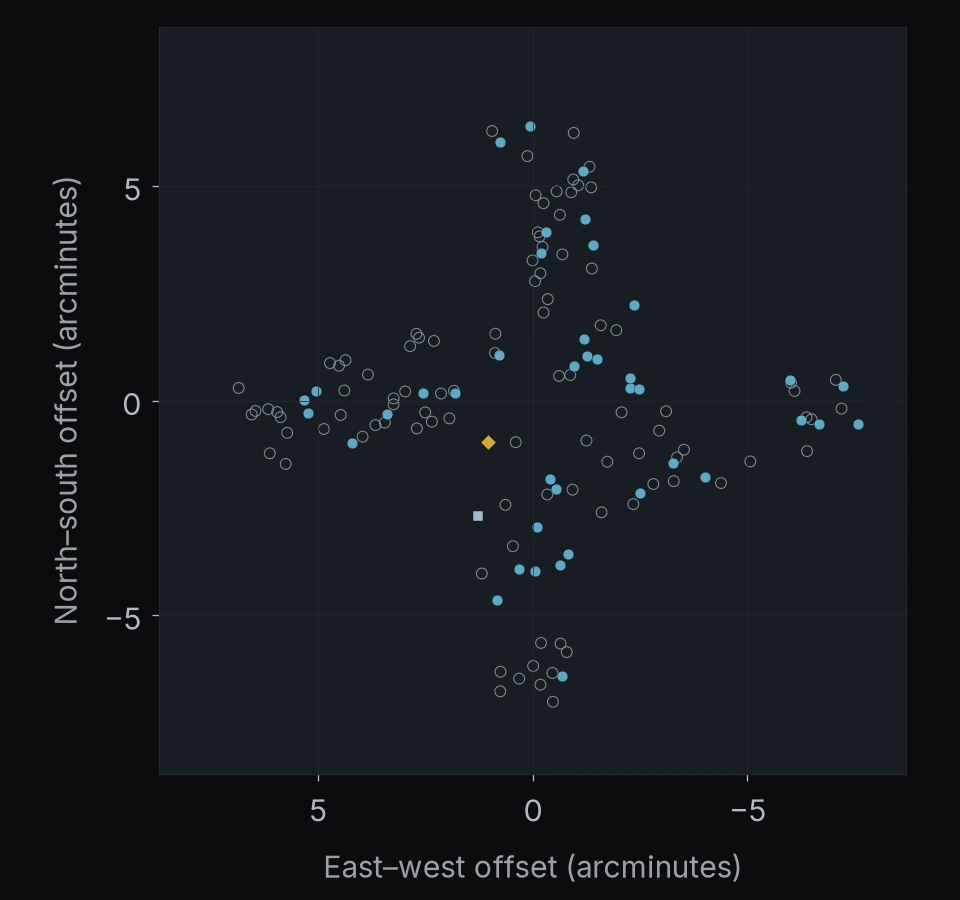
REGION 8 OF 122
POPPIES pointing 95
117 objects
- Watch list111
- BH* selection below redshift 36
North is up · east is left.
Axes show angular offsets from the region center.
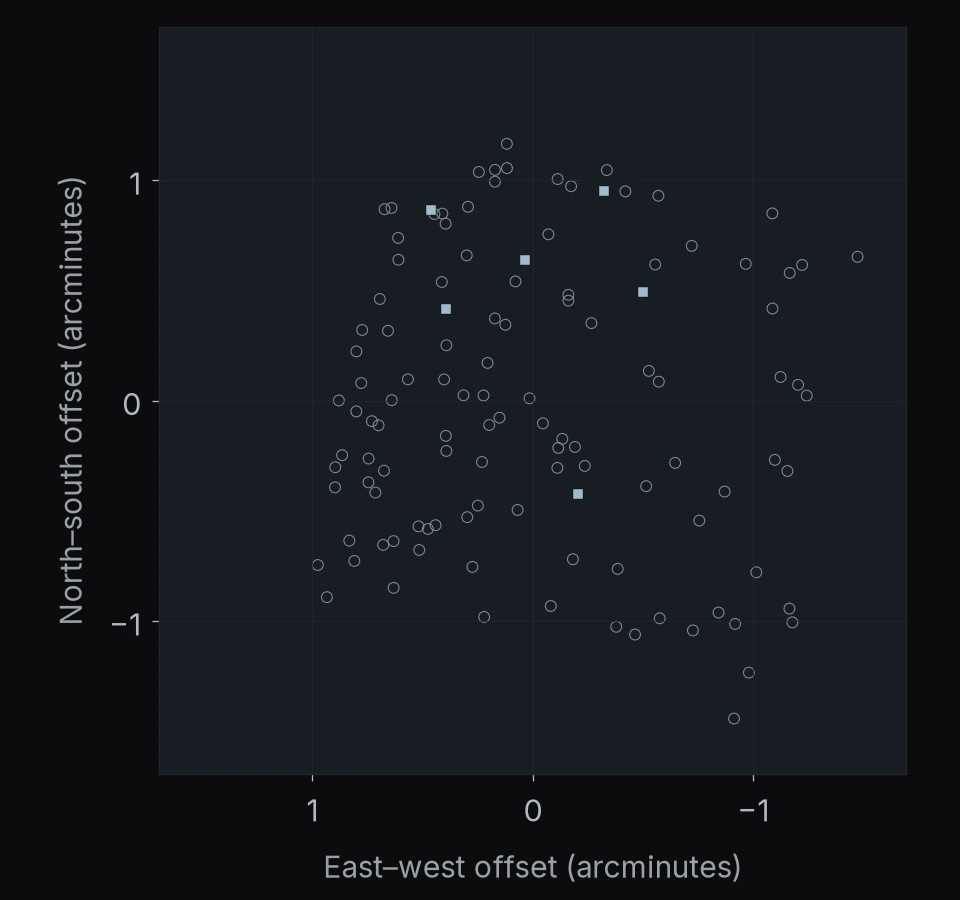
REGION 9 OF 122
Abell 2744 (UNCOVER)
93 objects
- Watch list53
- Selected after vetting13
- Recovered in published JWST catalogs27
North is up · east is left.
Axes show angular offsets from the region center.
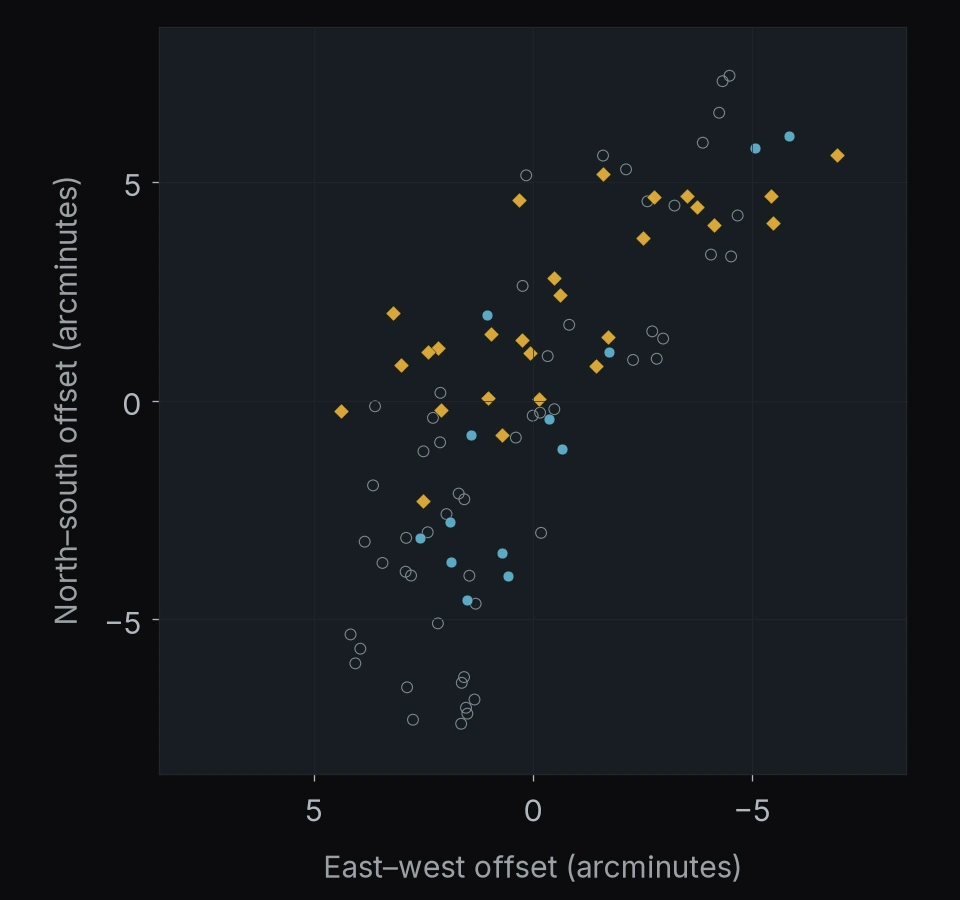
REGION 10 OF 122
PANORAMIC J125652+5652
88 objects
- Watch list67
- Selected after vetting19
- Recovered in published JWST catalogs2
North is up · east is left.
Axes show angular offsets from the region center.
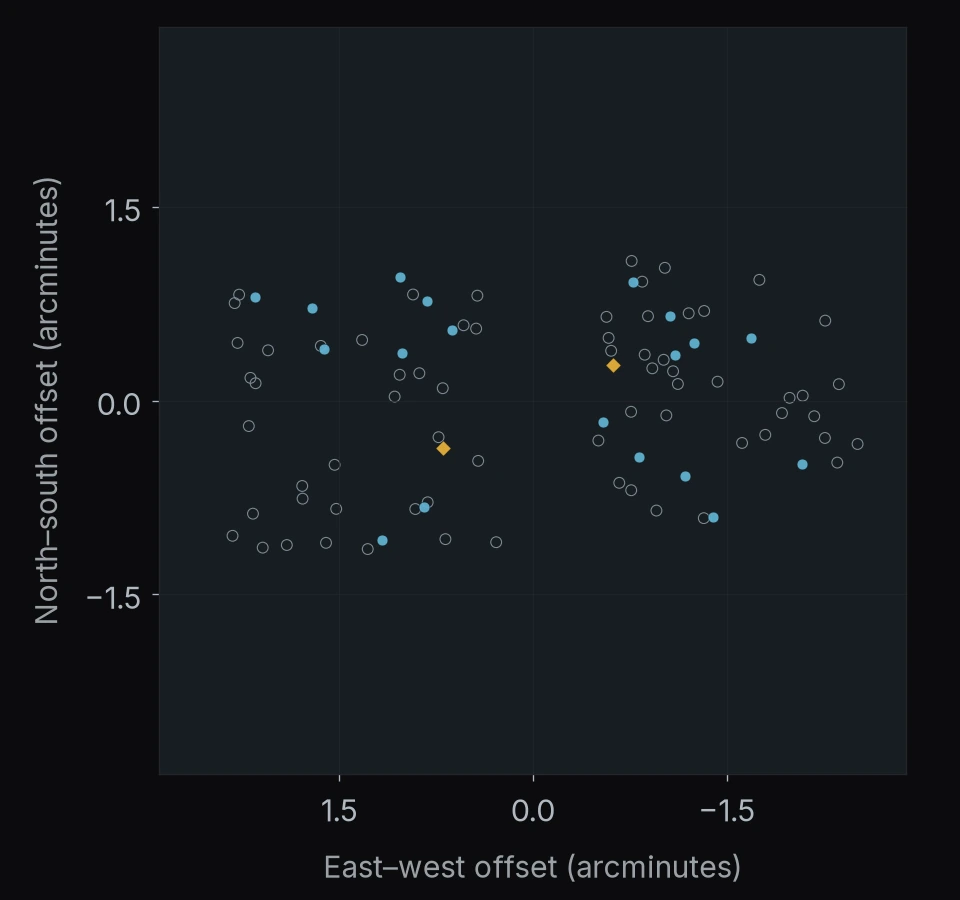
REGION 11 OF 122
PANORAMIC J153500+2325
64 objects
- Watch list43
- BH* selection below redshift 31
- Selected after vetting20
North is up · east is left.
Axes show angular offsets from the region center.
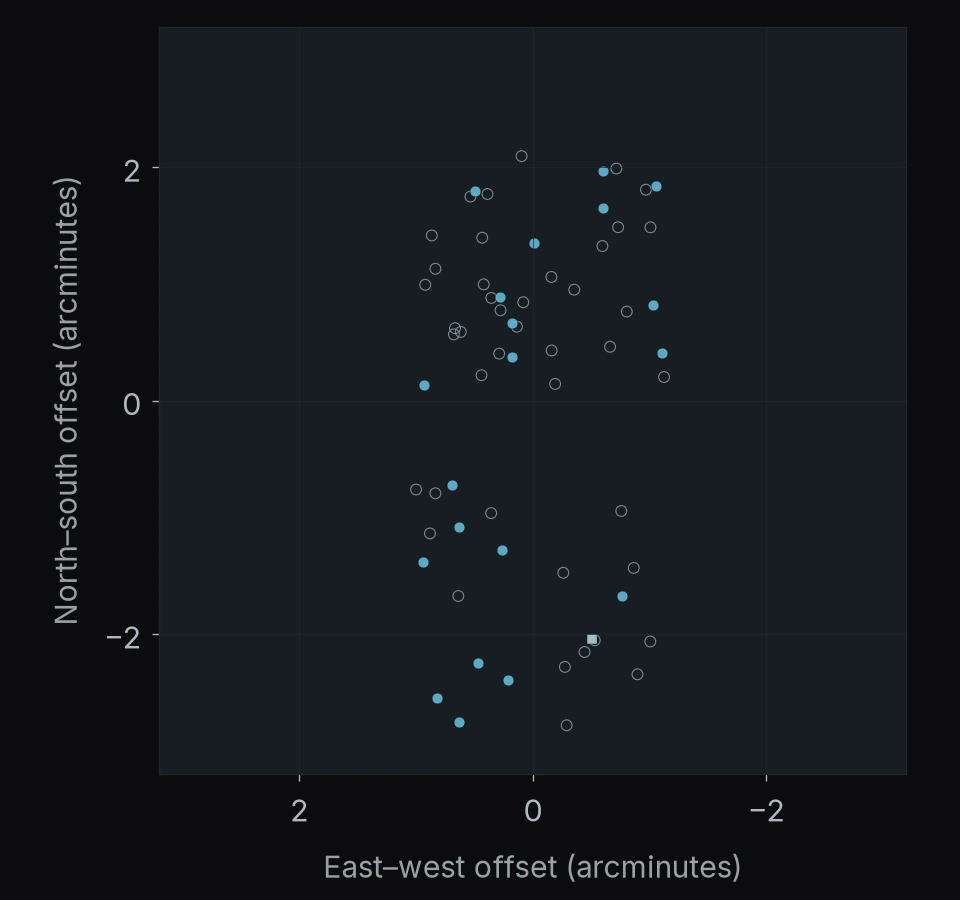
REGION 12 OF 122
MACS J0416.1-2403
59 objects
- Watch list38
- BH* selection below redshift 32
- Selected after vetting13
- Recovered in published JWST catalogs6
North is up · east is left.
Axes show angular offsets from the region center.
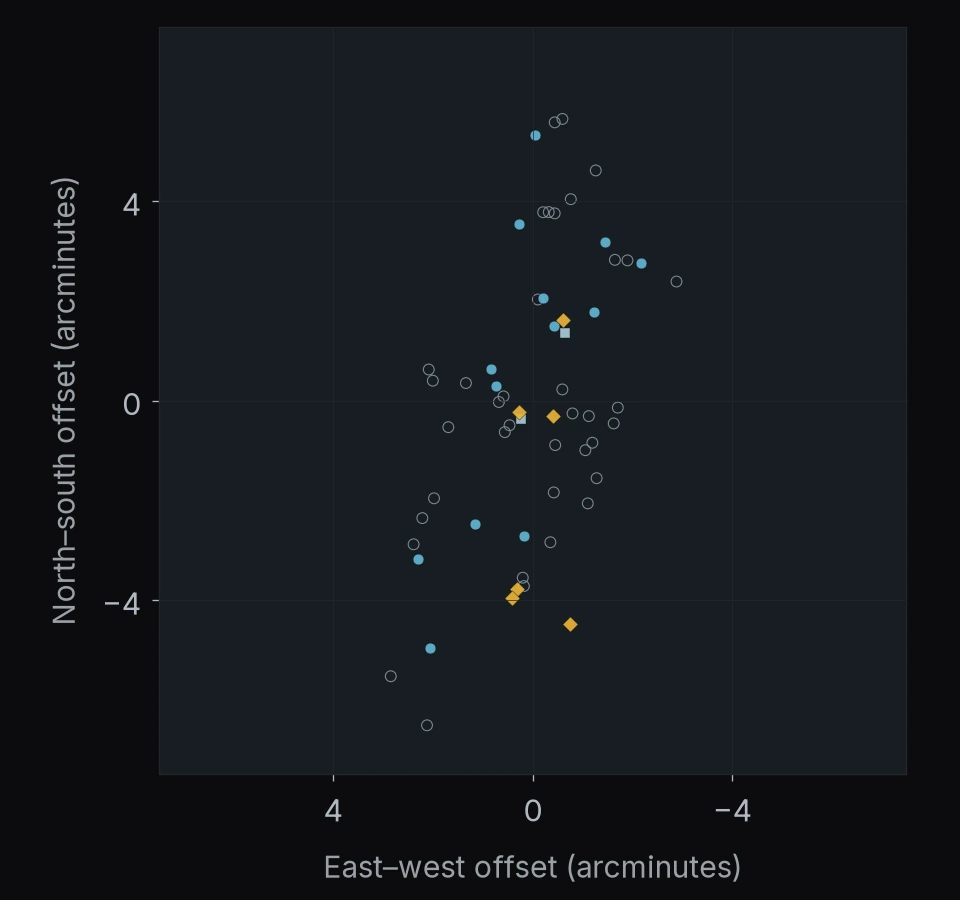
REGION 13 OF 122
POPPIES pointing 02
56 objects
- Watch list32
- Selected after vetting24
North is up · east is left.
Axes show angular offsets from the region center.
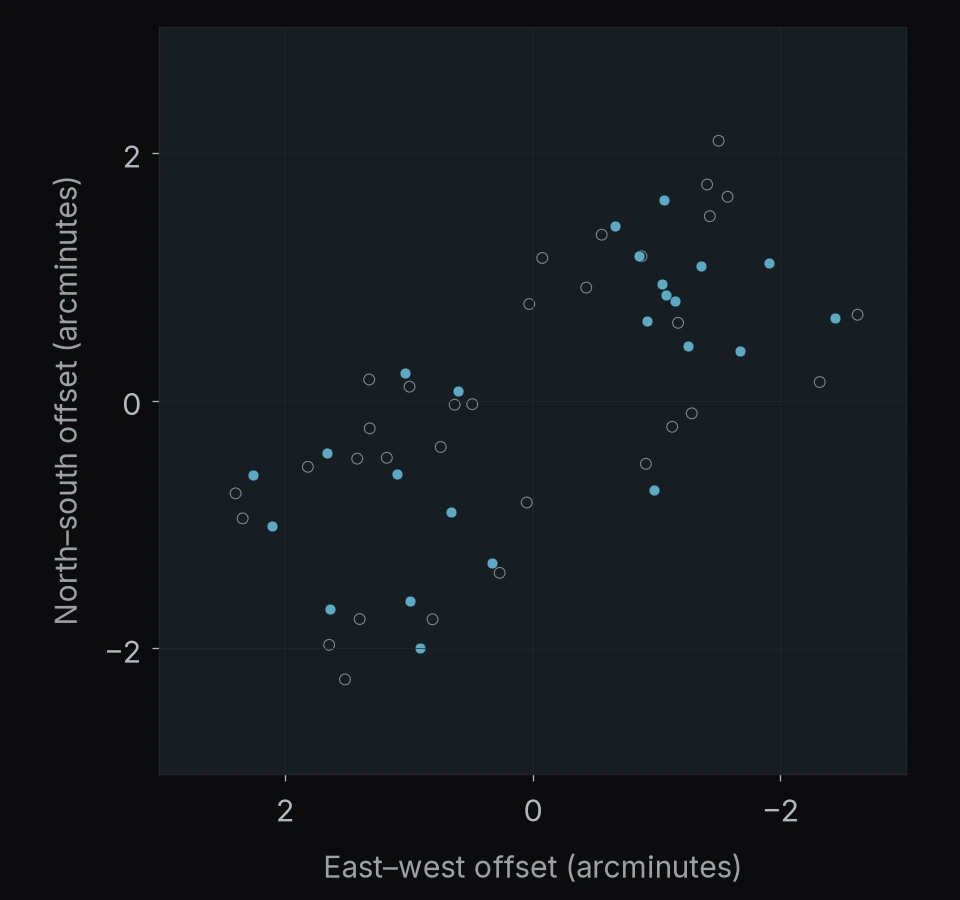
REGION 14 OF 122
RA 64.66° Dec -47.87°
50 objects
- Watch list50
North is up · east is left.
Axes show angular offsets from the region center.
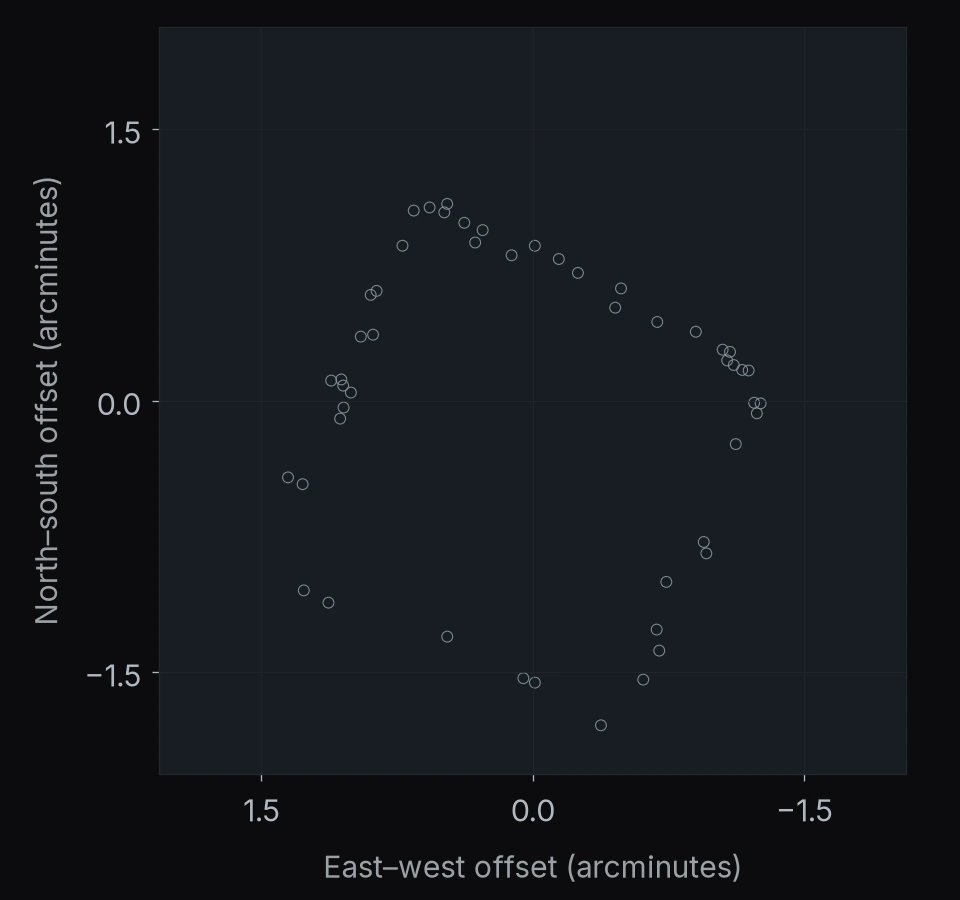
REGION 15 OF 122
PLCK G165.7+67.0
44 objects
- Watch list35
- Selected after vetting9
North is up · east is left.
Axes show angular offsets from the region center.
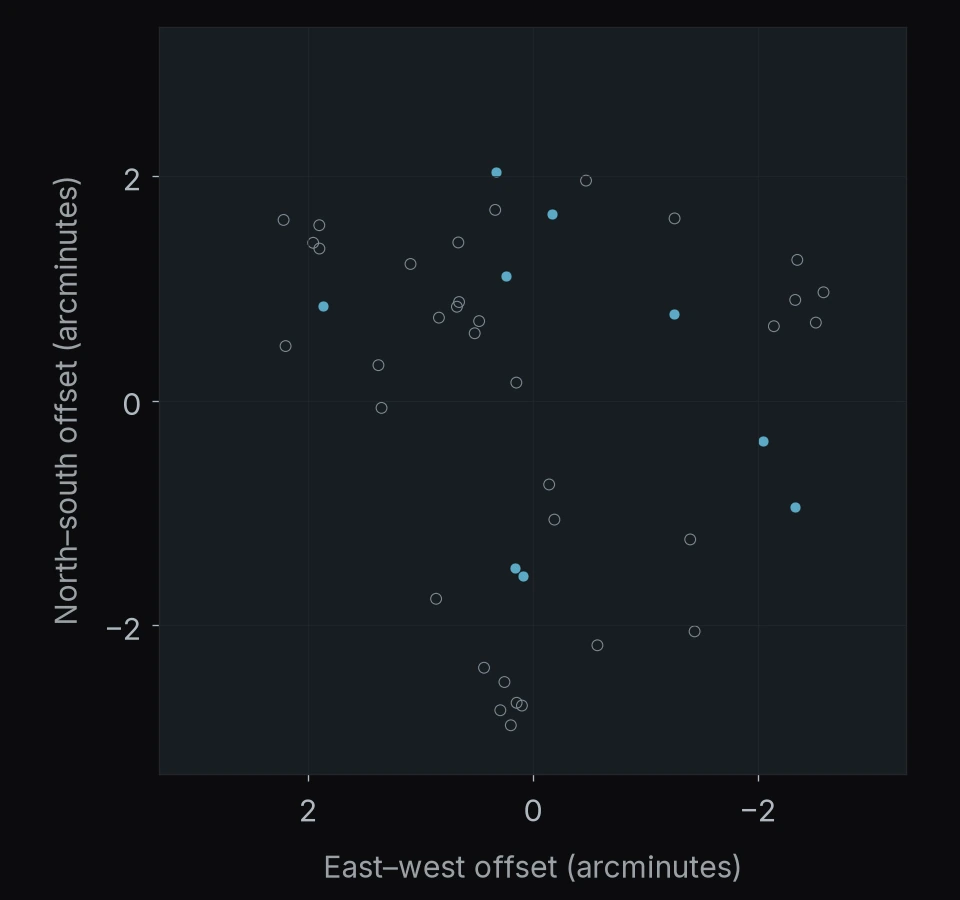
REGION 16 OF 122
PANORAMIC J021728-0214
39 objects
- Watch list28
- Selected after vetting9
- Recovered in published JWST catalogs2
North is up · east is left.
Axes show angular offsets from the region center.
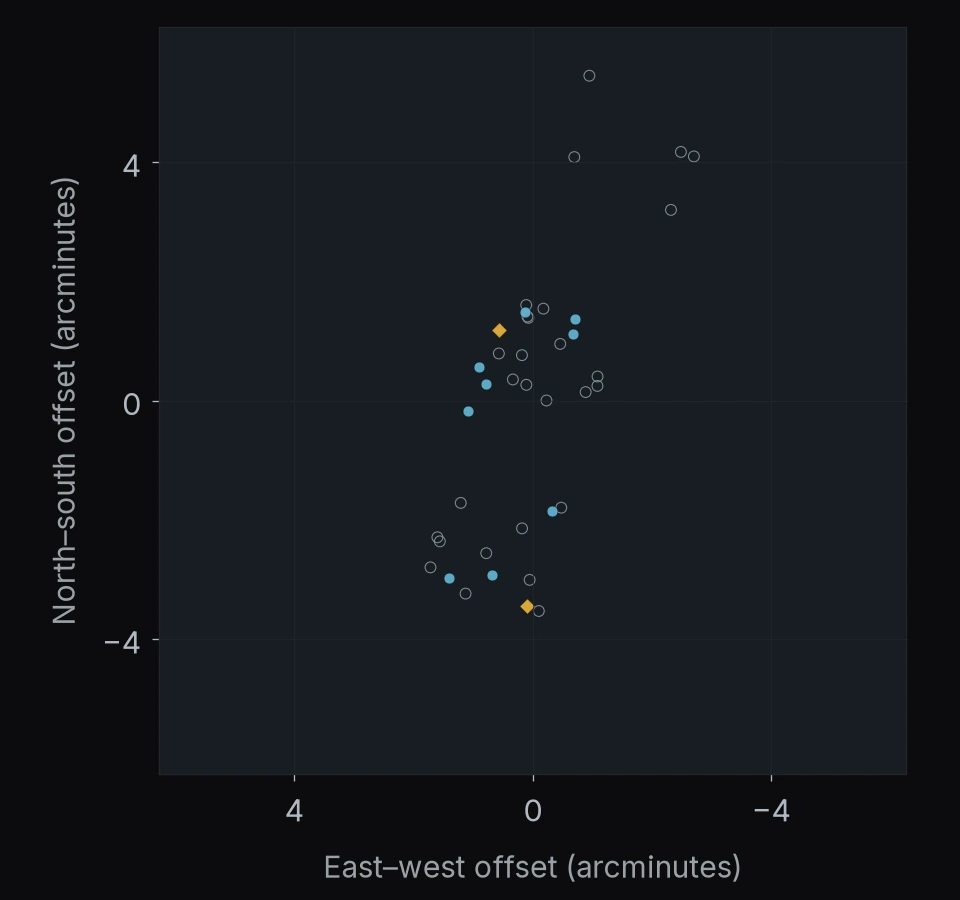
REGION 17 OF 122
PANORAMIC J031404-1759
38 objects
- Watch list29
- BH* selection below redshift 31
- Selected after vetting6
- Recovered in published JWST catalogs2
North is up · east is left.
Axes show angular offsets from the region center.
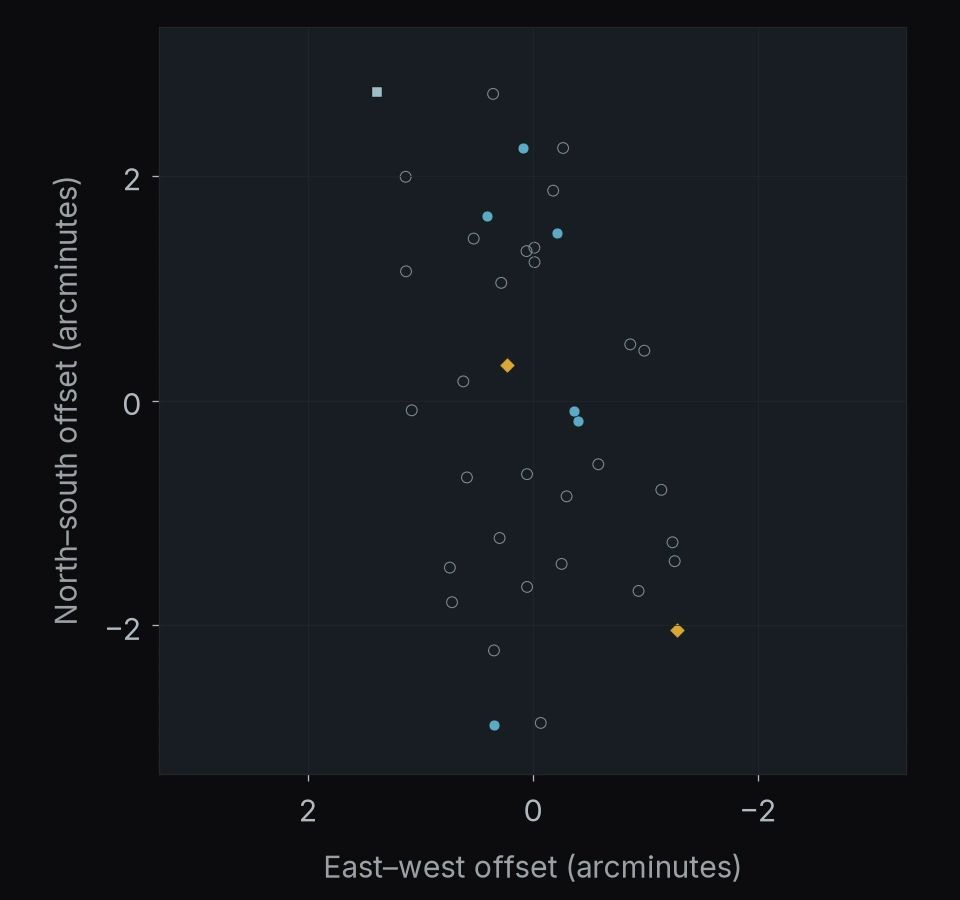
REGION 18 OF 122
PANORAMIC J224604-0518
36 objects
- Watch list18
- Selected after vetting17
- Recovered in published JWST catalogs1
North is up · east is left.
Axes show angular offsets from the region center.
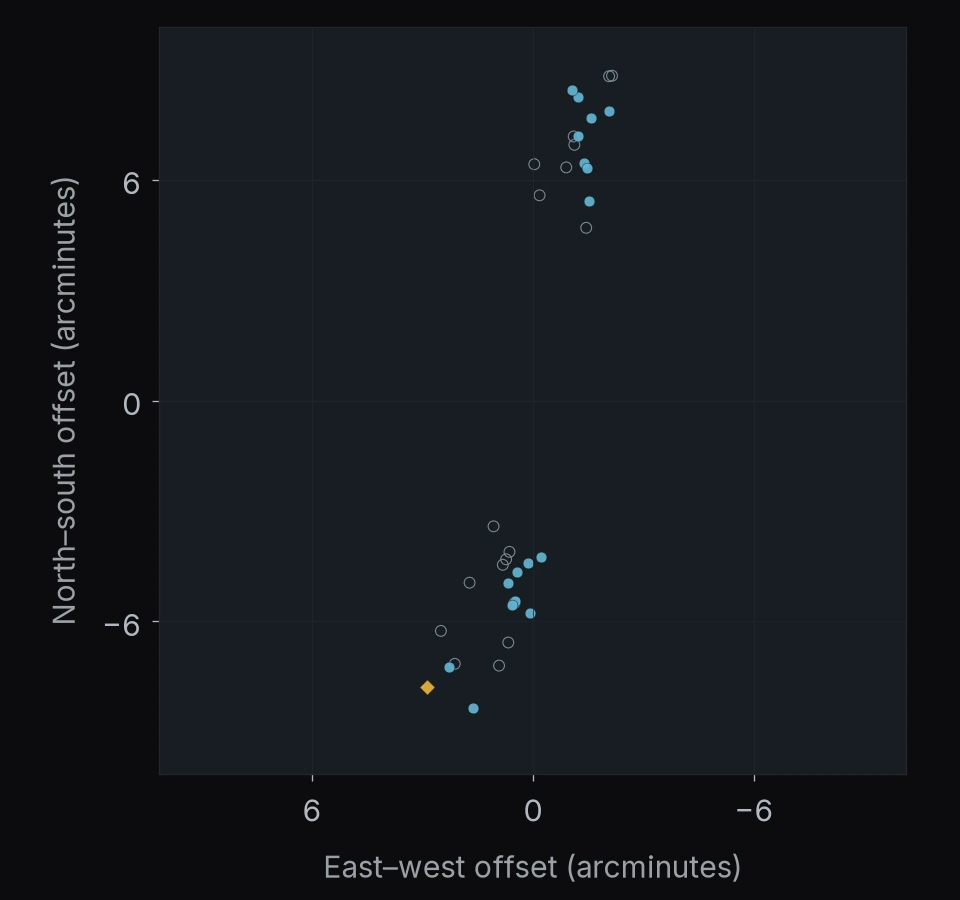
REGION 19 OF 122
Abell 370
35 objects
- Watch list25
- Selected after vetting9
- Recovered in published JWST catalogs1
North is up · east is left.
Axes show angular offsets from the region center.
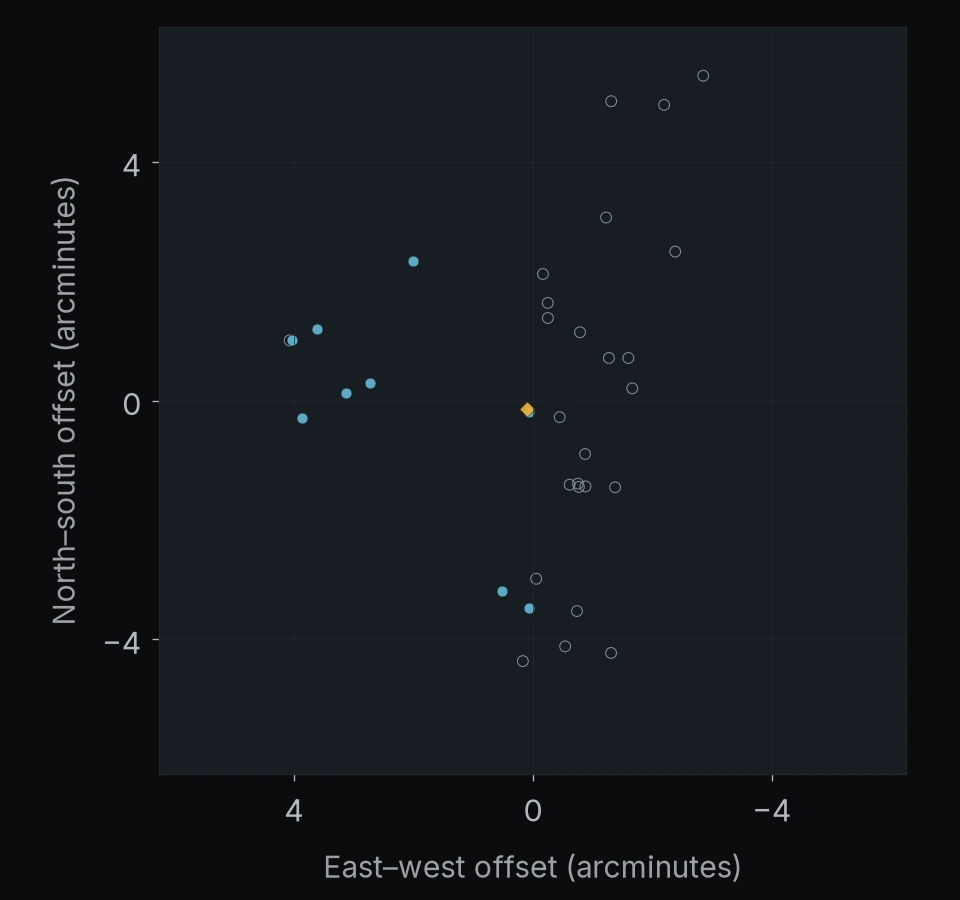
REGION 20 OF 122
PANORAMIC J221648+0025
32 objects
- Watch list21
- BH* selection below redshift 32
- Selected after vetting8
- Recovered in published JWST catalogs1
North is up · east is left.
Axes show angular offsets from the region center.
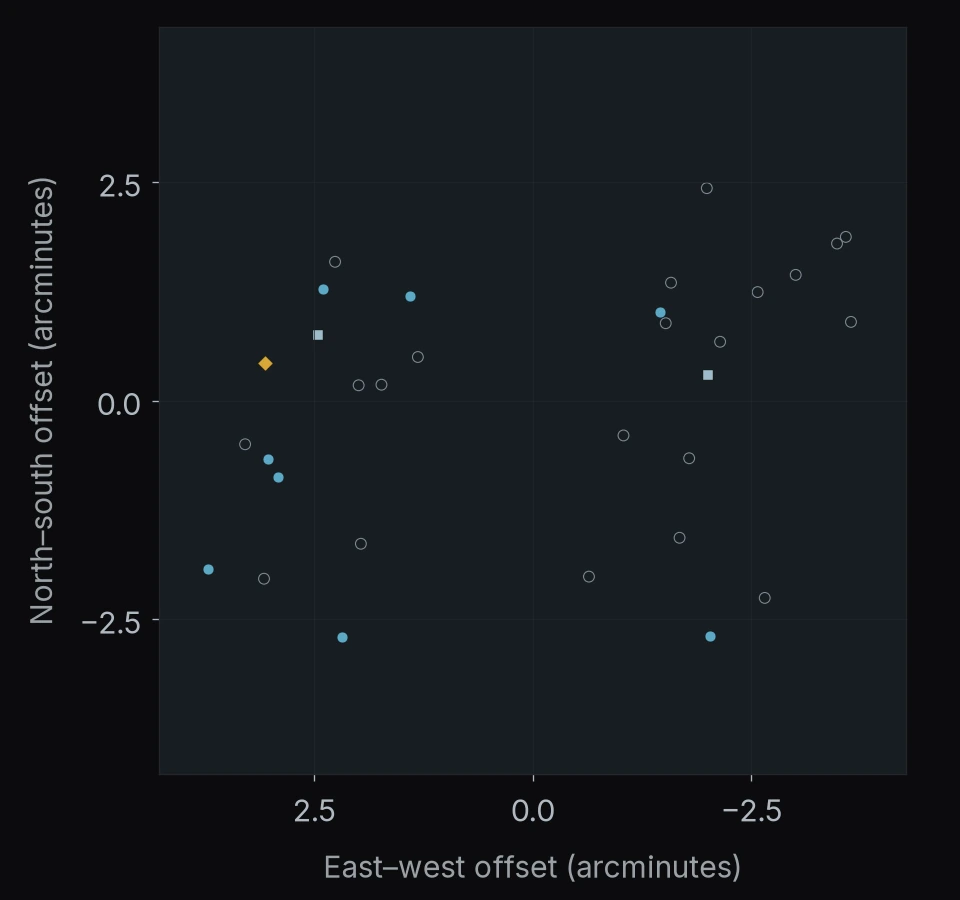
REGION 21 OF 122
MS 0451.6-0305
32 objects
- Watch list23
- BH* selection below redshift 31
- Selected after vetting8
North is up · east is left.
Axes show angular offsets from the region center.
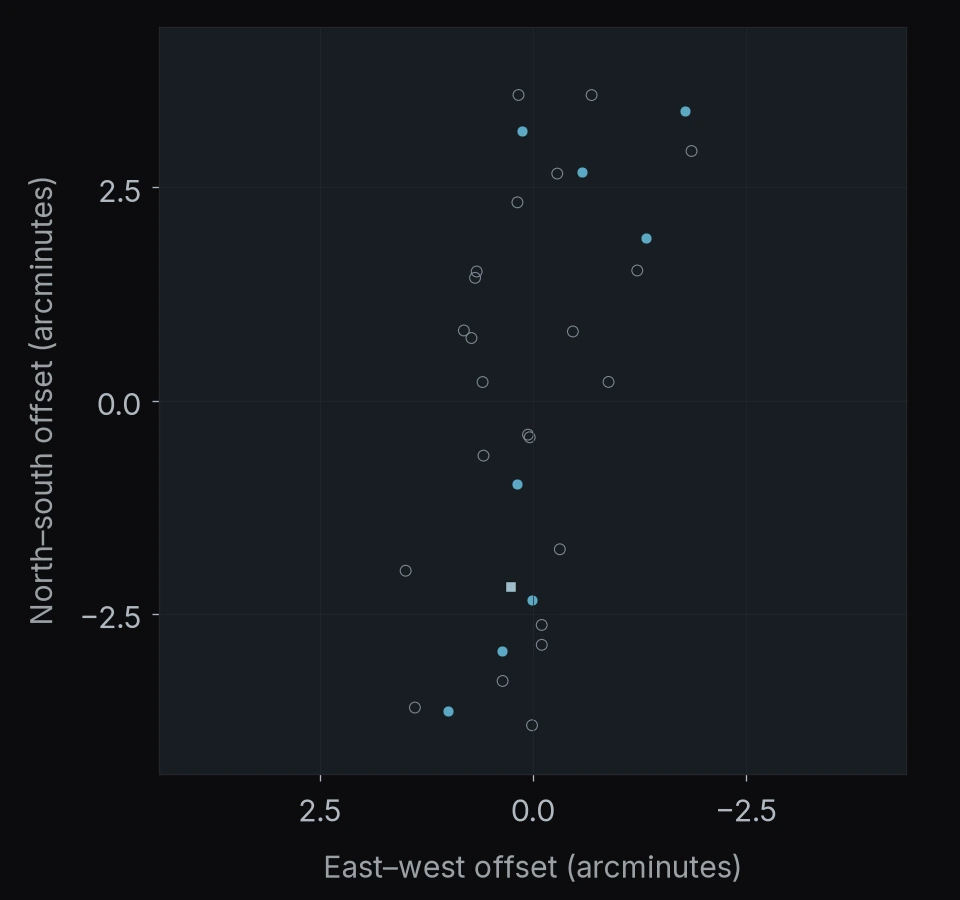
REGION 22 OF 122
POPPIES 01
31 objects
- Watch list31
North is up · east is left.
Axes show angular offsets from the region center.
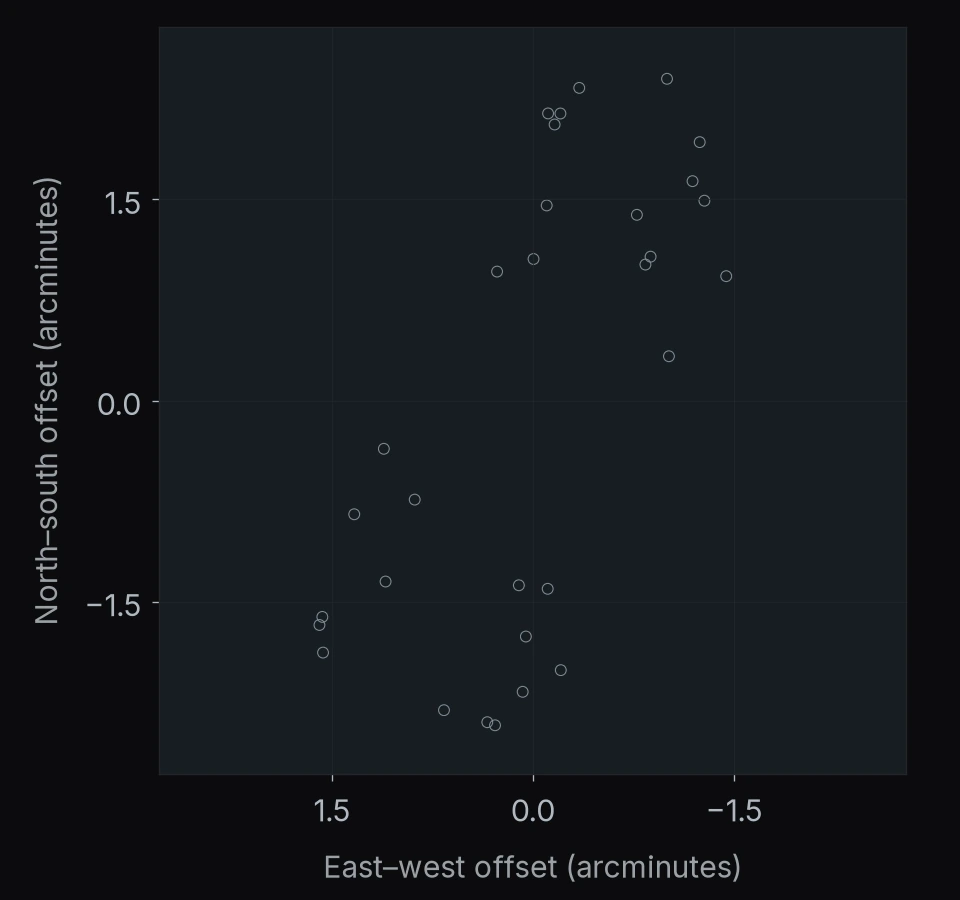
REGION 23 OF 122
MACS J1423.8+2404
29 objects
- Watch list20
- Selected after vetting9
North is up · east is left.
Axes show angular offsets from the region center.
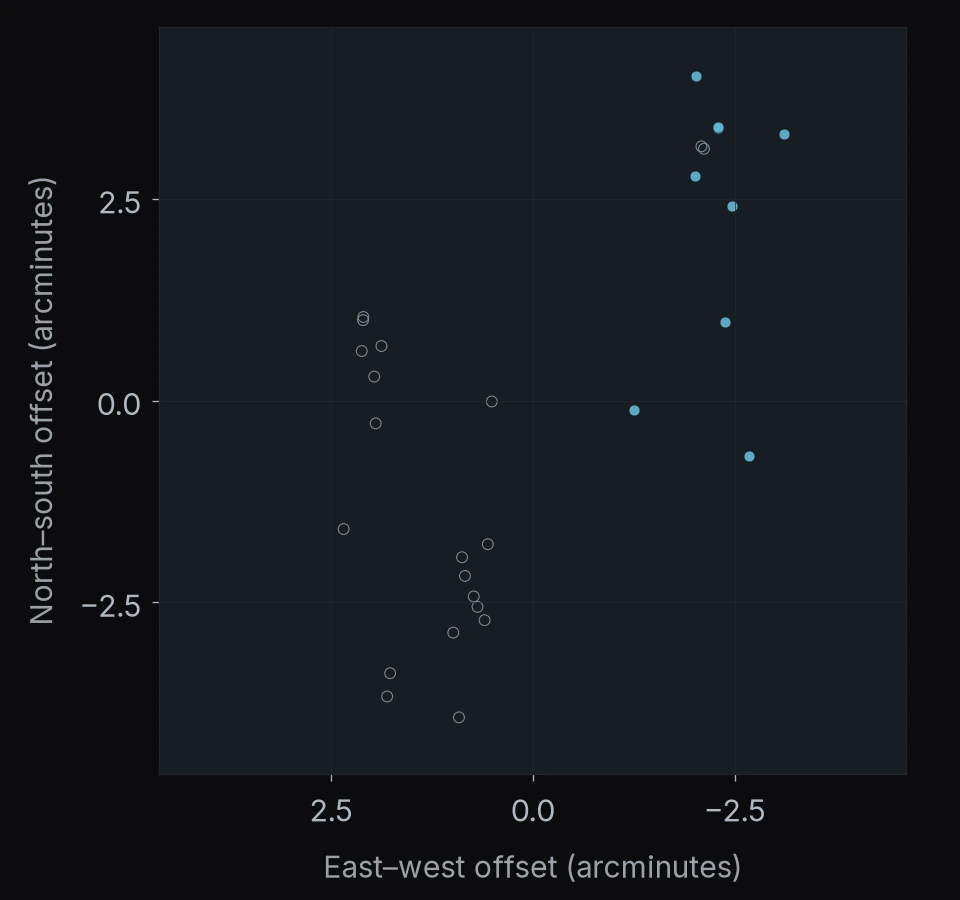
REGION 24 OF 122
RXC J0032.1+1808
27 objects
- Watch list21
- Selected after vetting6
North is up · east is left.
Axes show angular offsets from the region center.
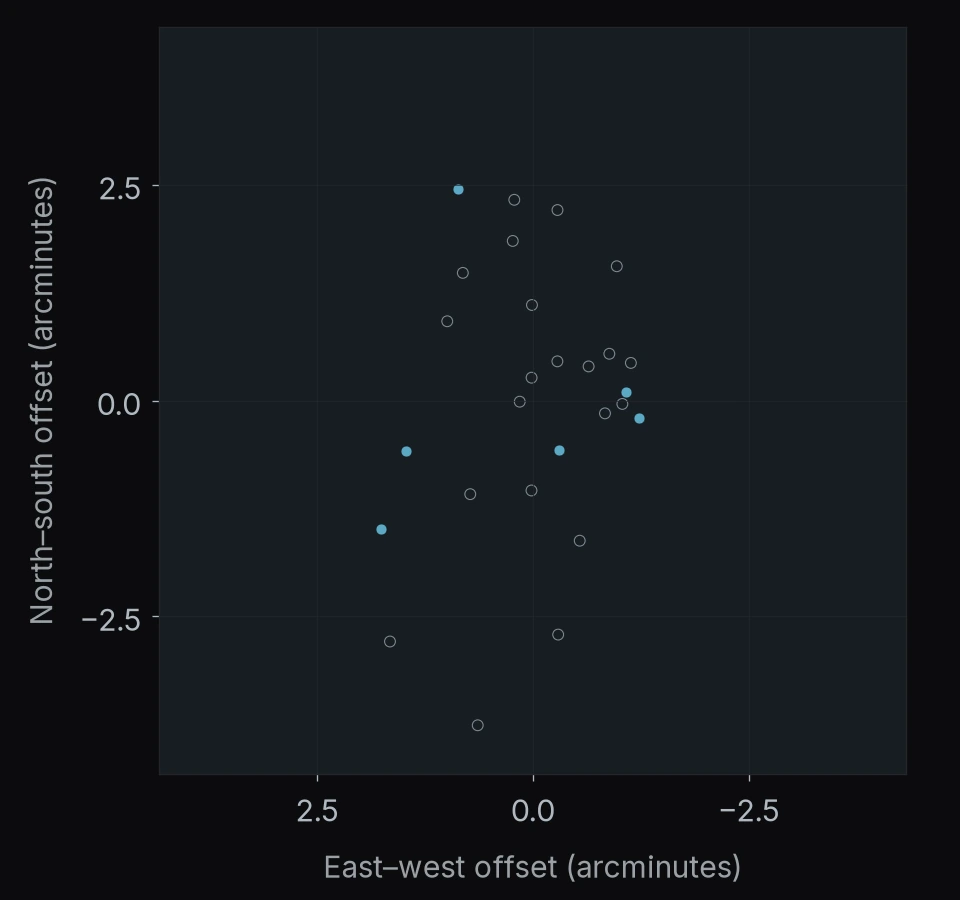
REGION 25 OF 122
PANORAMIC J013900-1019
26 objects
- Watch list18
- Selected after vetting7
- Recovered in published JWST catalogs1
North is up · east is left.
Axes show angular offsets from the region center.
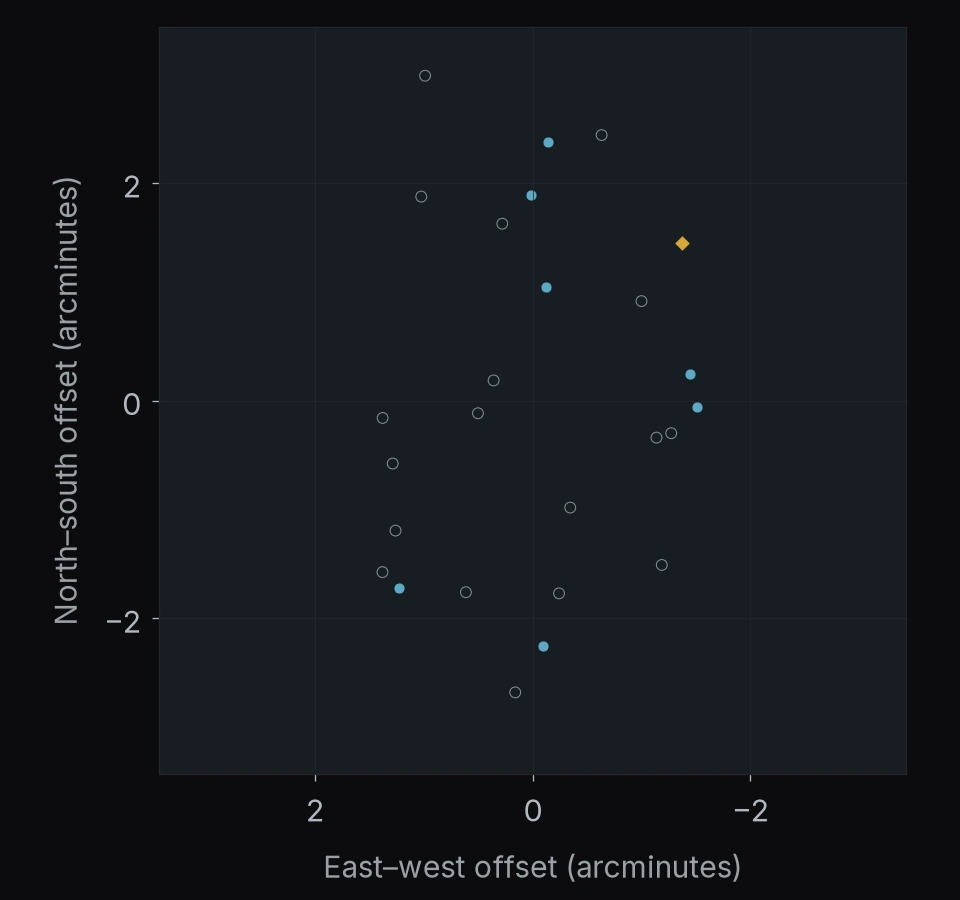
REGION 26 OF 122
PANORAMIC J014428+1715
25 objects
- Watch list15
- Selected after vetting6
- Recovered in published JWST catalogs4
North is up · east is left.
Axes show angular offsets from the region center.
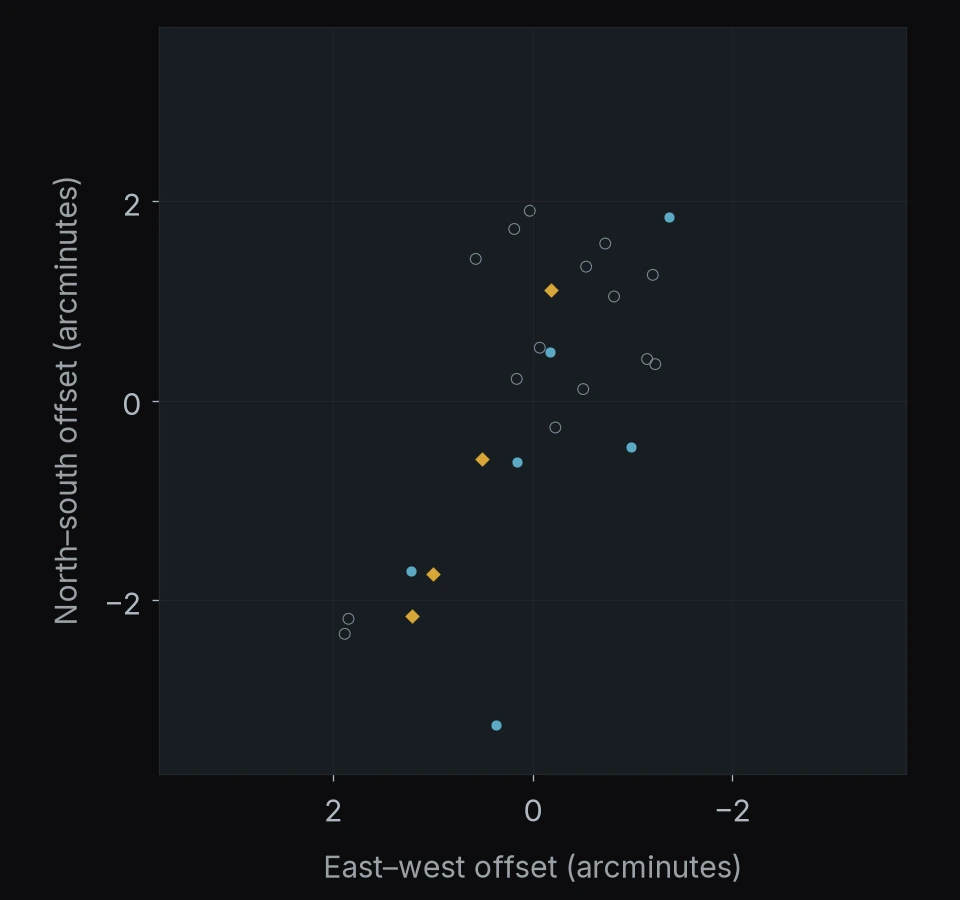
REGION 27 OF 122
PLCK G191.24+62.04
24 objects
- Watch list20
- Selected after vetting4
North is up · east is left.
Axes show angular offsets from the region center.
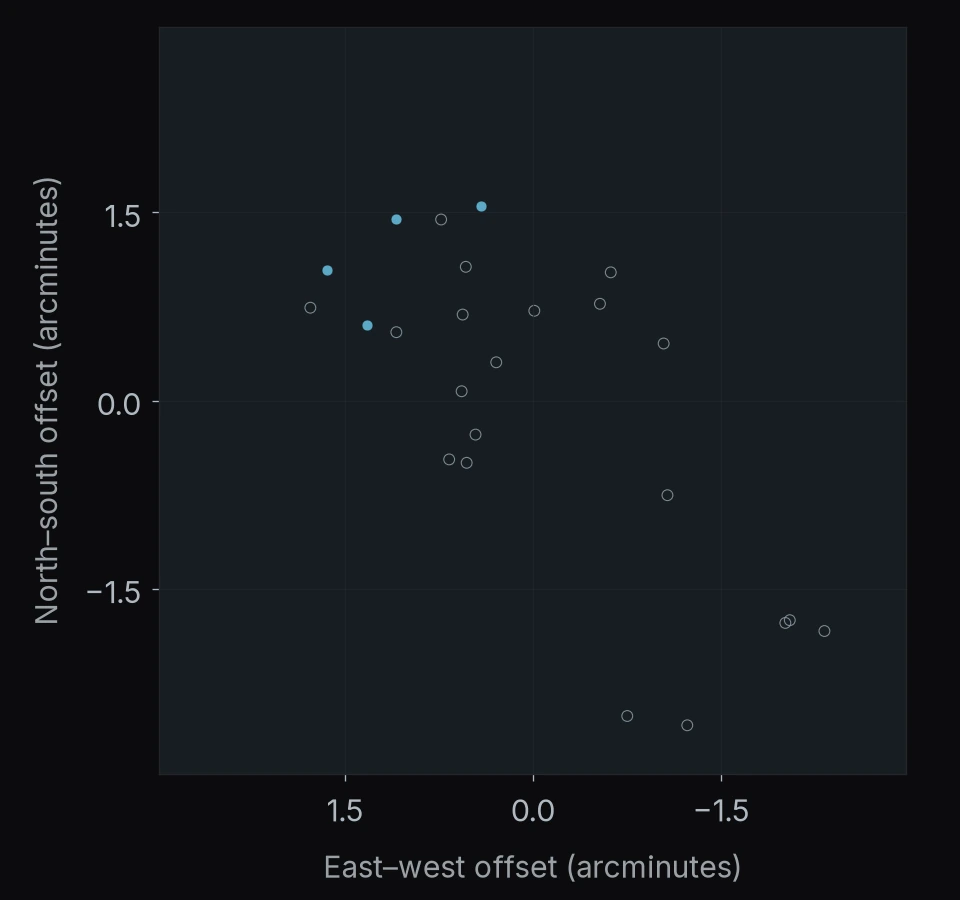
REGION 28 OF 122
PLCK G171.9-40.7
23 objects
- Watch list18
- BH* selection below redshift 31
- Selected after vetting4
North is up · east is left.
Axes show angular offsets from the region center.
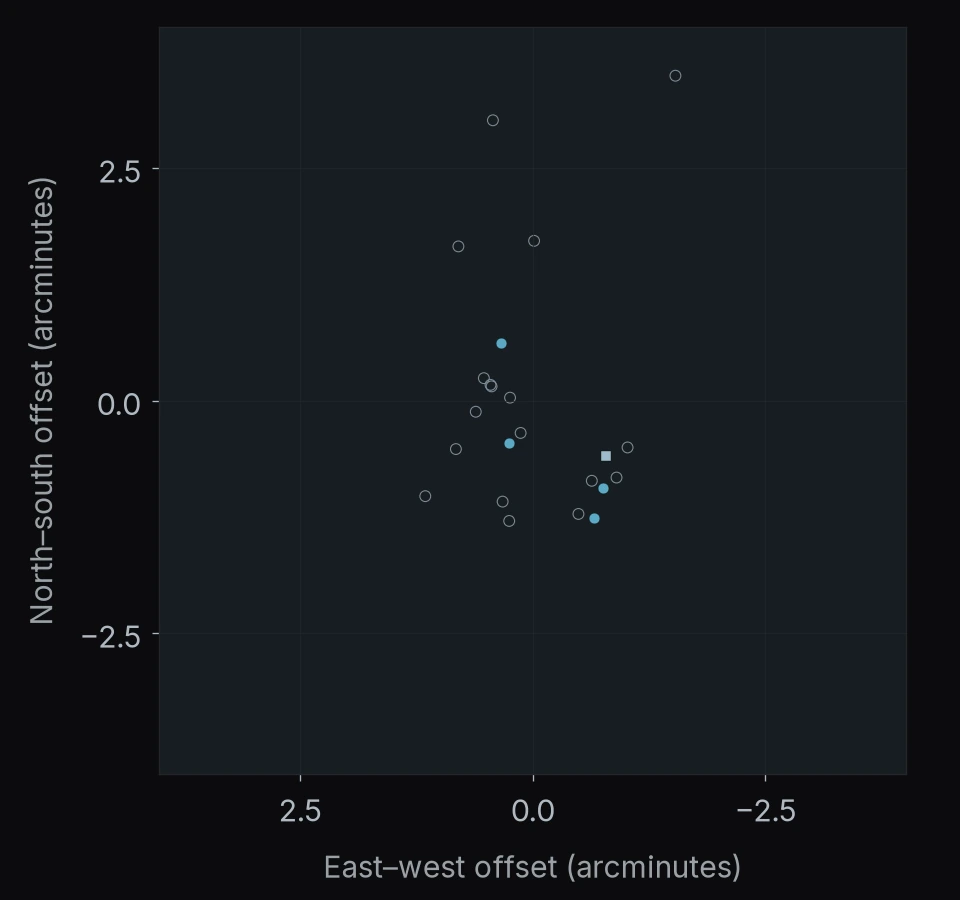
REGION 29 OF 122
PANORAMIC J142536+5630
23 objects
- Watch list14
- BH* selection below redshift 31
- Selected after vetting4
- Recovered in published JWST catalogs4
North is up · east is left.
Axes show angular offsets from the region center.
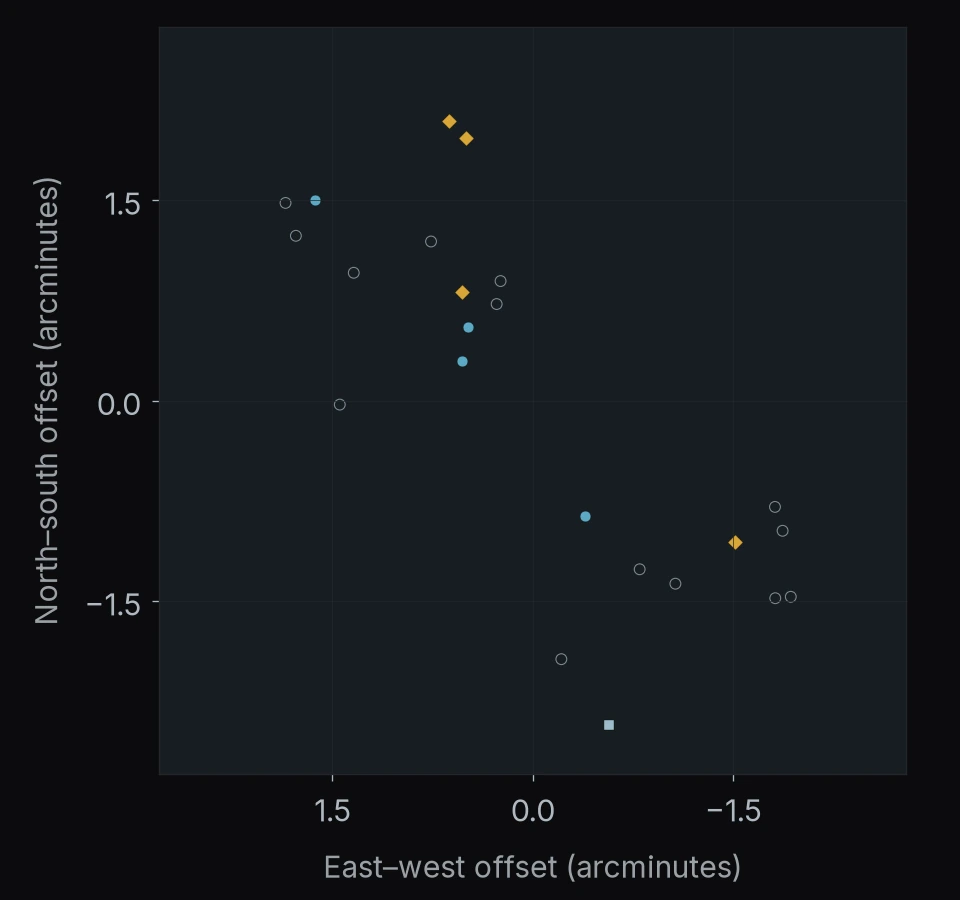
REGION 30 OF 122
GAMA-100033
23 objects
- Watch list19
- Selected after vetting4
North is up · east is left.
Axes show angular offsets from the region center.
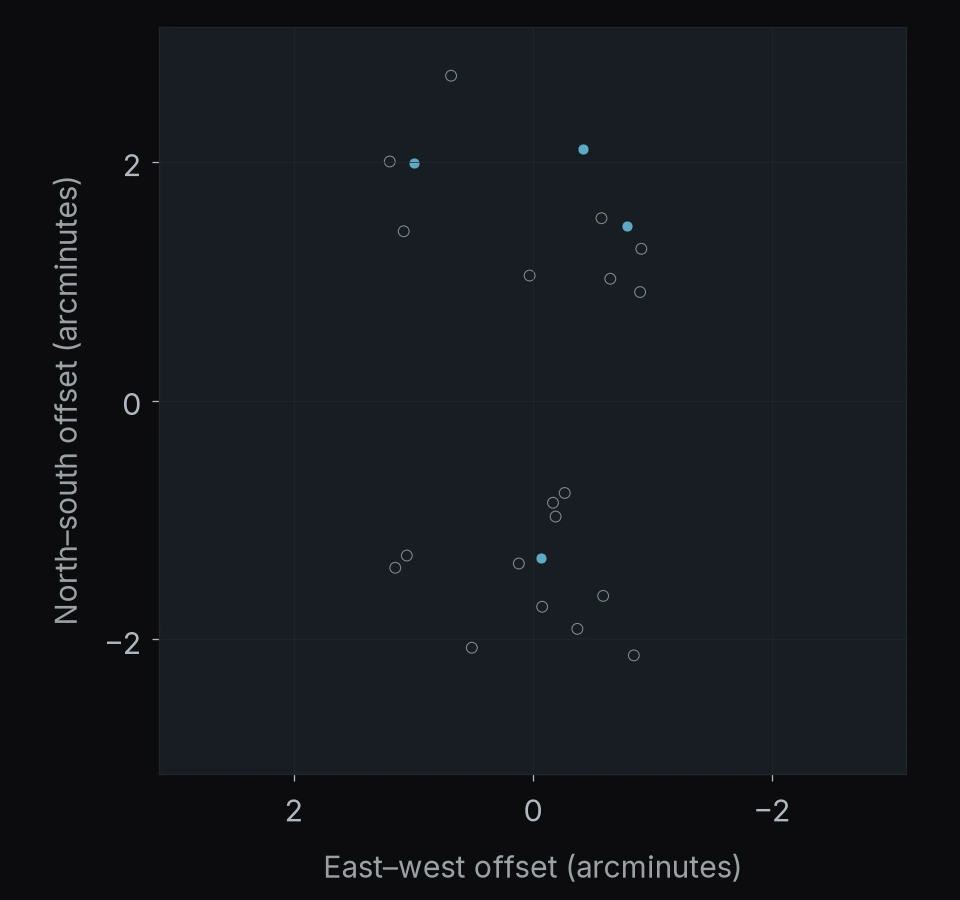
REGION 31 OF 122
Abell 68
22 objects
- Watch list20
- Selected after vetting2
North is up · east is left.
Axes show angular offsets from the region center.
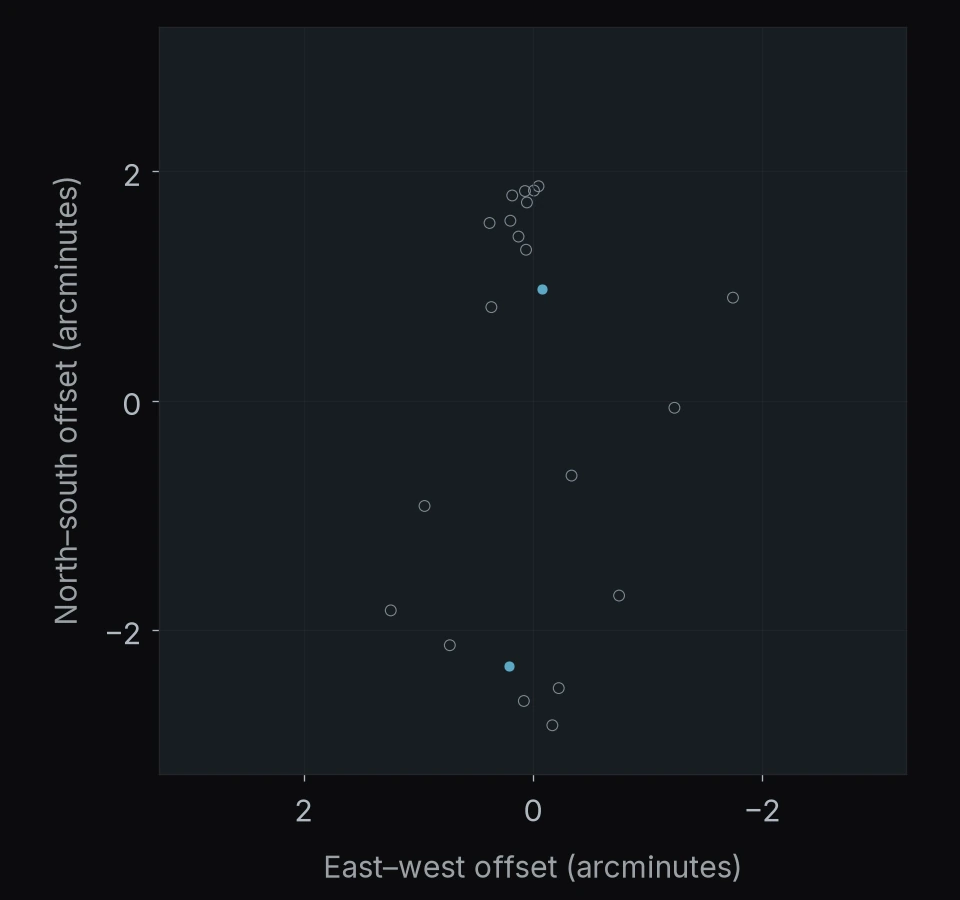
REGION 32 OF 122
CL J0152.7-1357
22 objects
- Watch list19
- Selected after vetting3
North is up · east is left.
Axes show angular offsets from the region center.
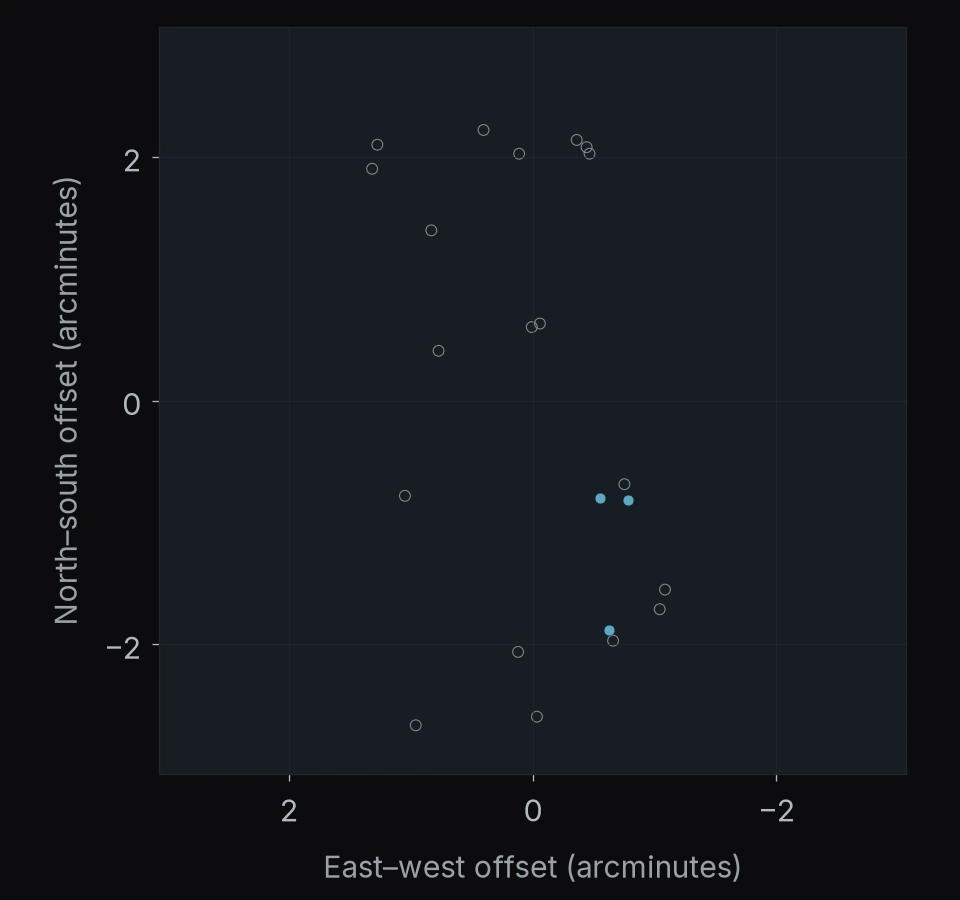
REGION 33 OF 122
PANORAMIC J094232+0923
22 objects
- Watch list15
- Selected after vetting6
- Recovered in published JWST catalogs1
North is up · east is left.
Axes show angular offsets from the region center.
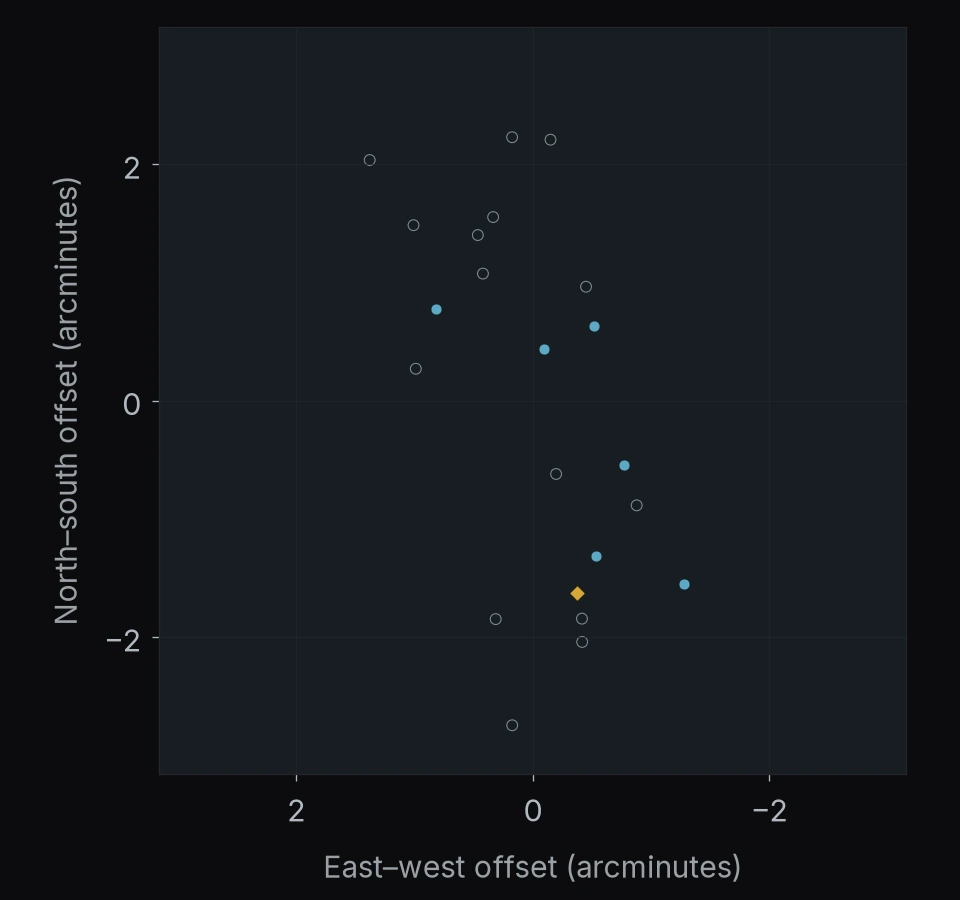
REGION 34 OF 122
MACS J1149.5+2223
22 objects
- Watch list17
- Selected after vetting5
North is up · east is left.
Axes show angular offsets from the region center.
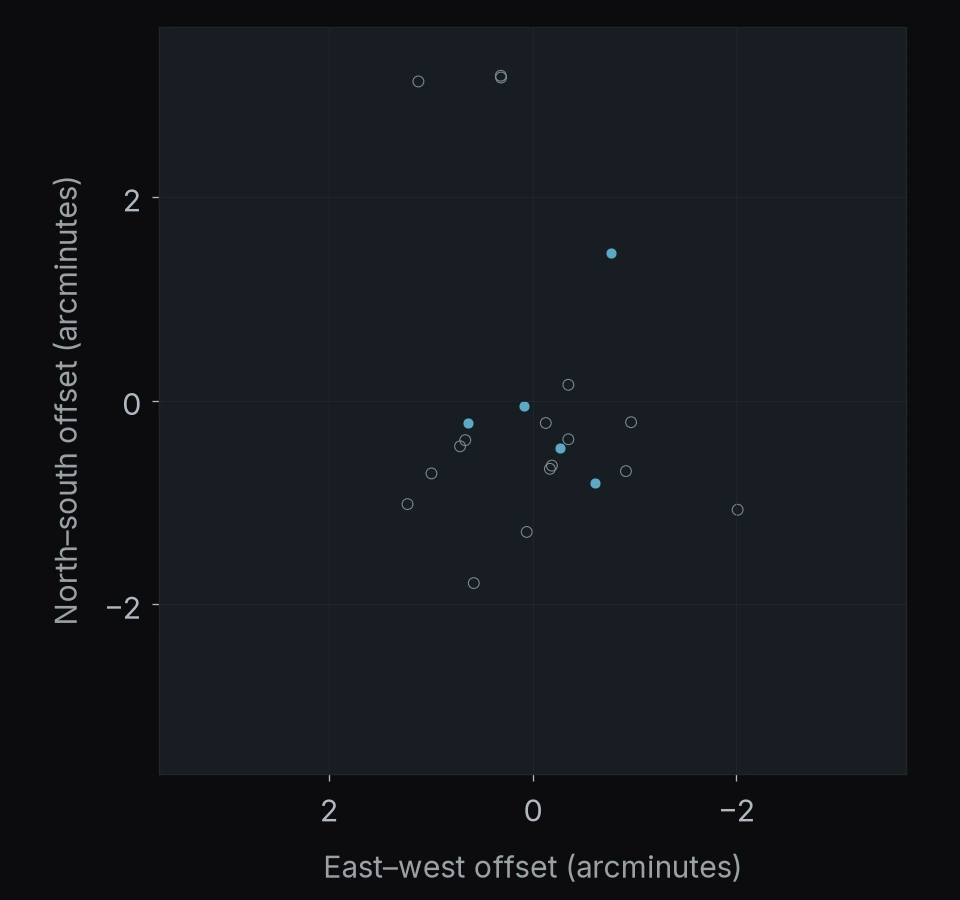
REGION 35 OF 122
RXC J0600.1-2007
21 objects
- Watch list11
- Selected after vetting10
North is up · east is left.
Axes show angular offsets from the region center.
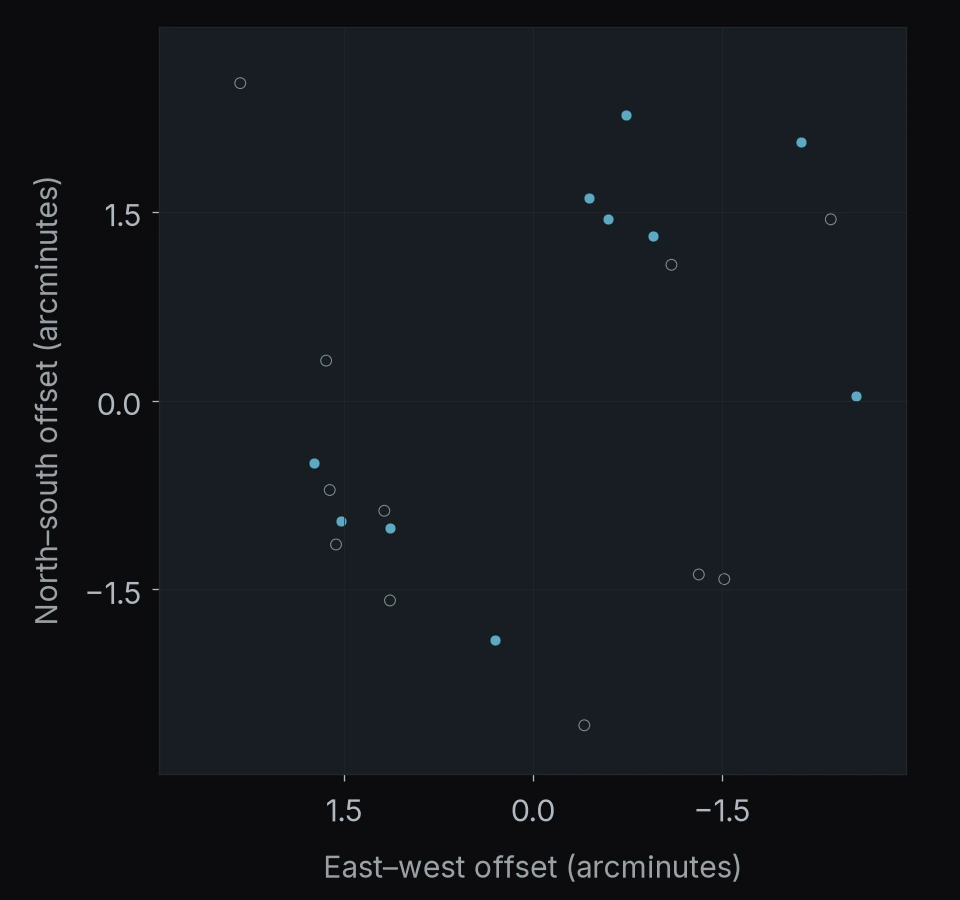
REGION 36 OF 122
MACS J0417.5-1154
21 objects
- Watch list14
- Selected after vetting6
- Recovered in published JWST catalogs1
North is up · east is left.
Axes show angular offsets from the region center.
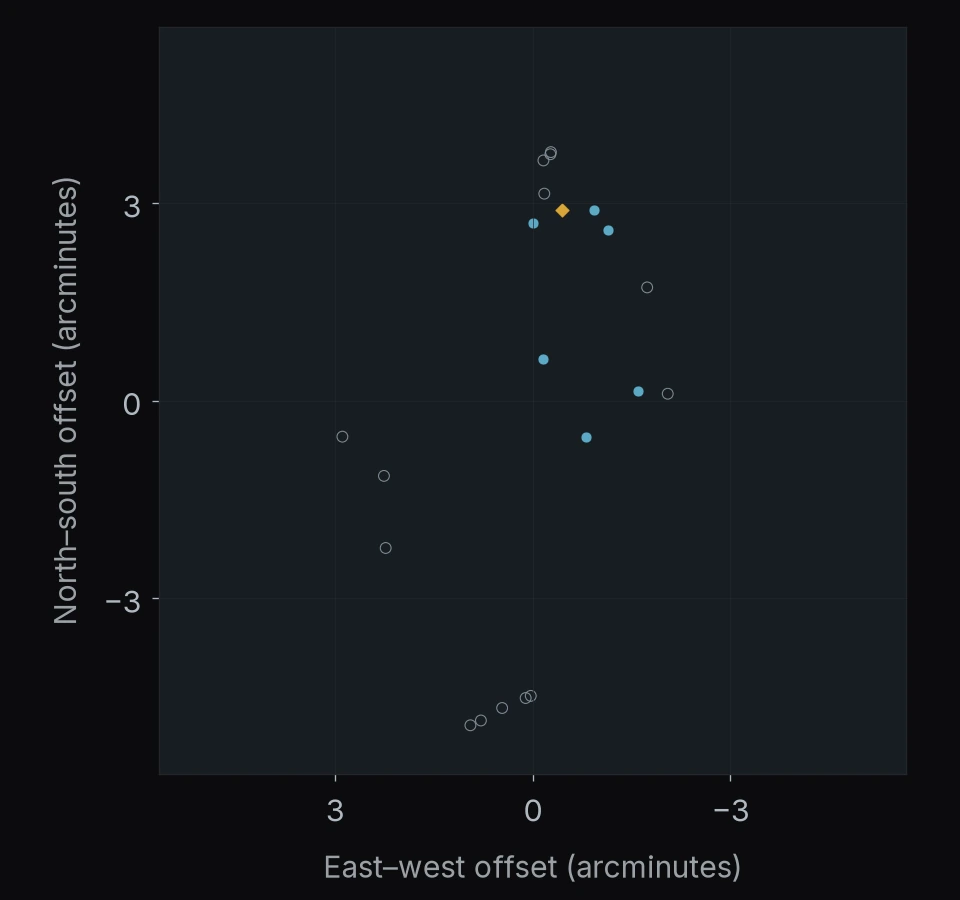
REGION 37 OF 122
SDSS J0129-0035
20 objects
- Watch list14
- Selected after vetting6
North is up · east is left.
Axes show angular offsets from the region center.
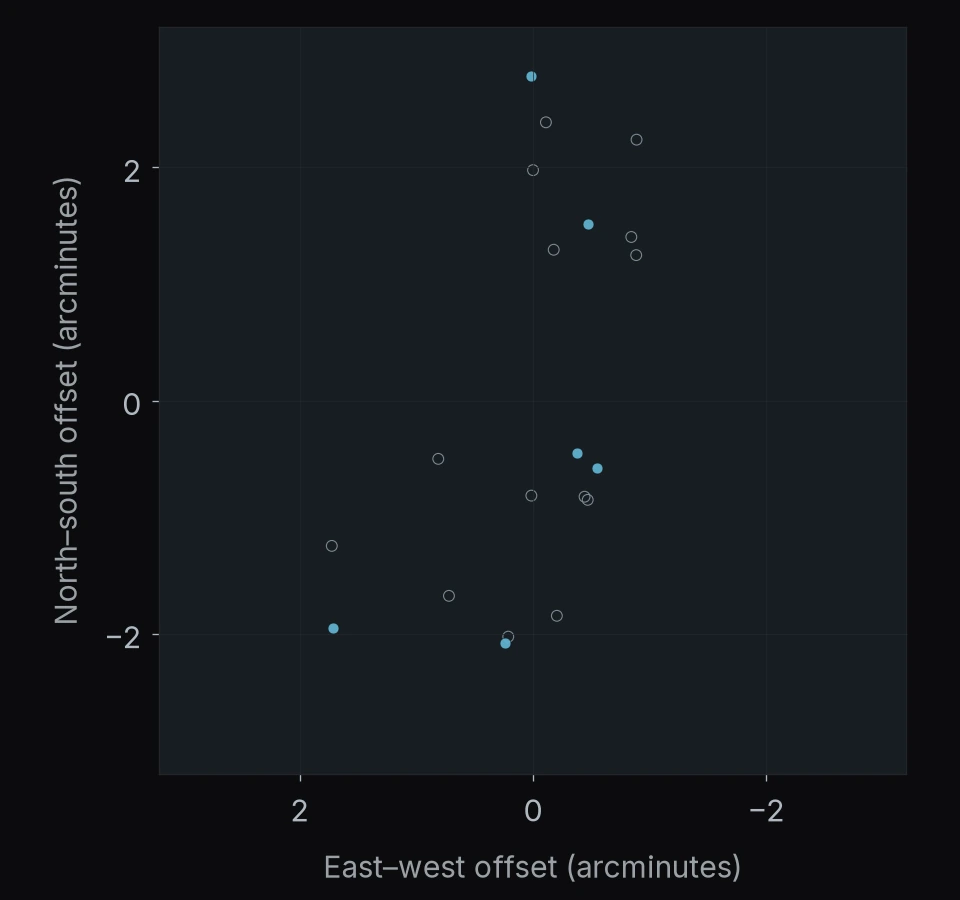
REGION 38 OF 122
PJ0846+15
20 objects
- Watch list19
- Selected after vetting1
North is up · east is left.
Axes show angular offsets from the region center.
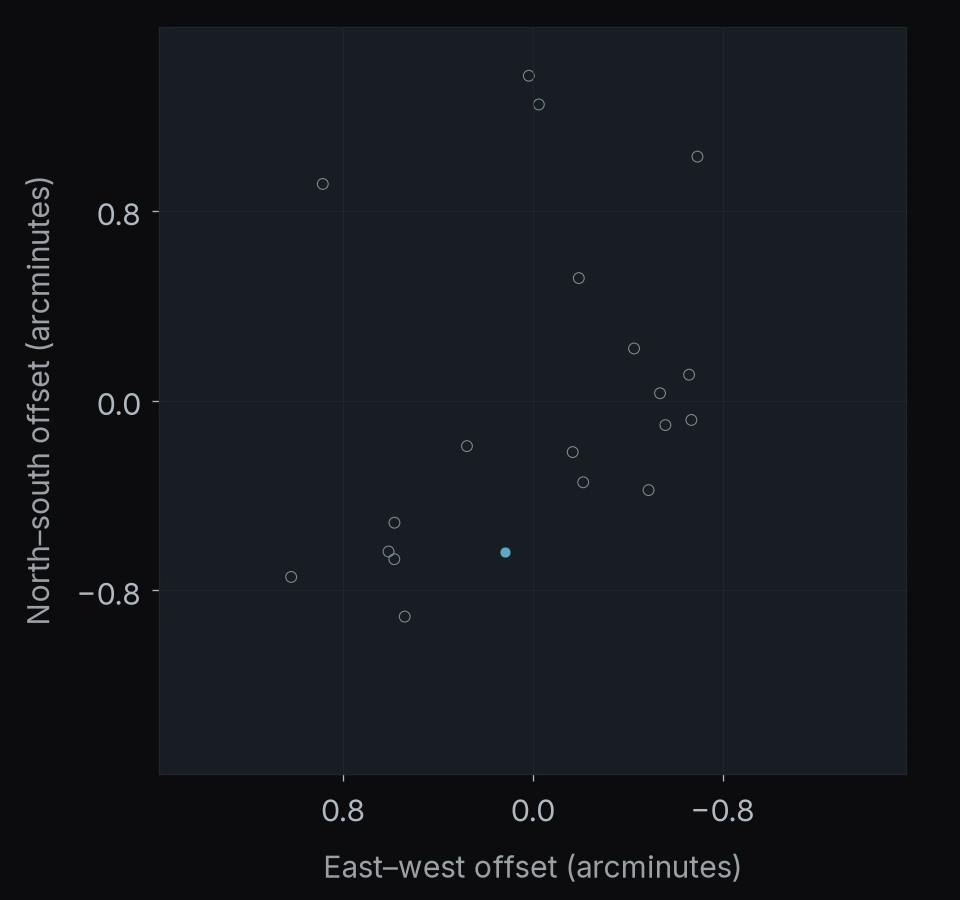
REGION 39 OF 122
ClG J1212+2733
20 objects
- Watch list19
- Selected after vetting1
North is up · east is left.
Axes show angular offsets from the region center.
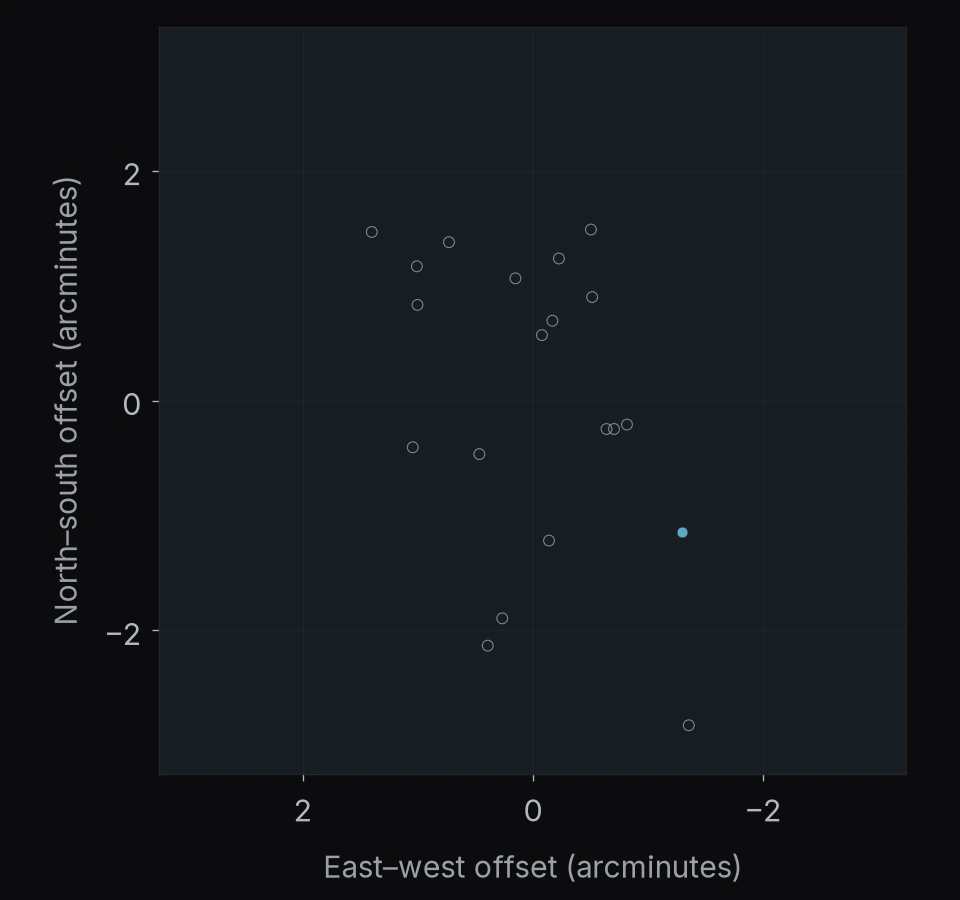
REGION 40 OF 122
MACS J0025.4-1222
19 objects
- Watch list16
- Selected after vetting3
North is up · east is left.
Axes show angular offsets from the region center.
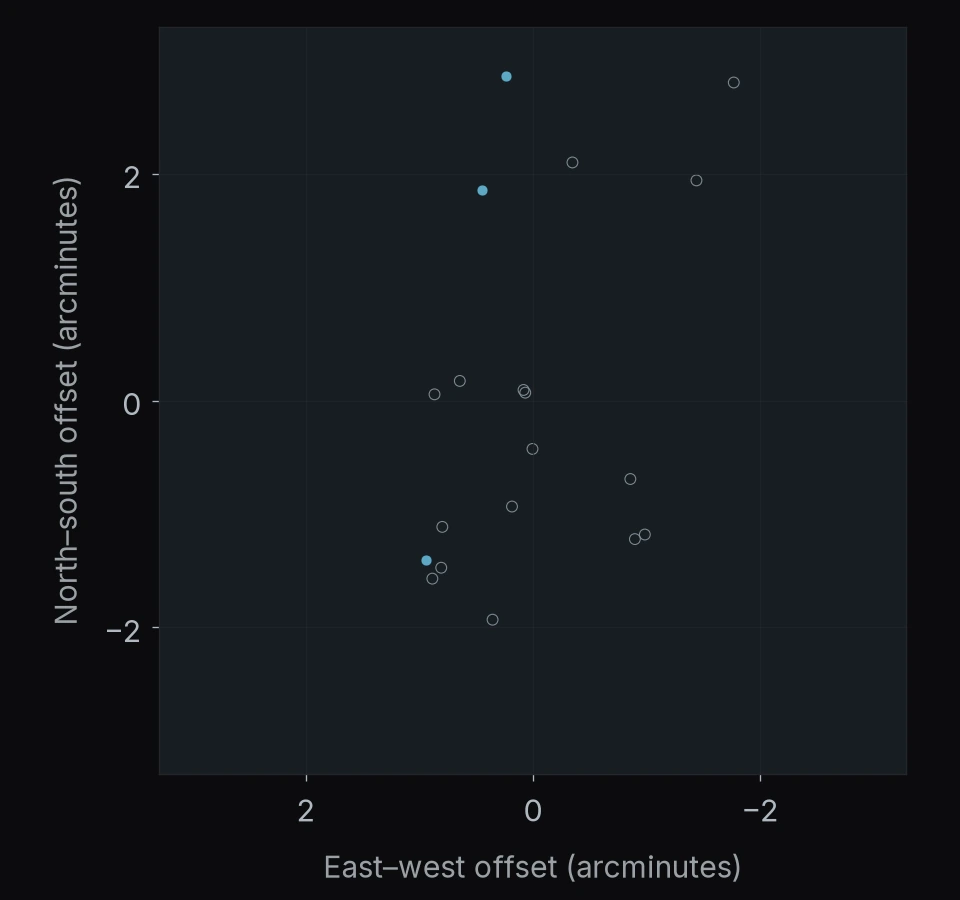
REGION 41 OF 122
SMACS J0723.3-7327
18 objects
- Watch list14
- Selected after vetting4
North is up · east is left.
Axes show angular offsets from the region center.
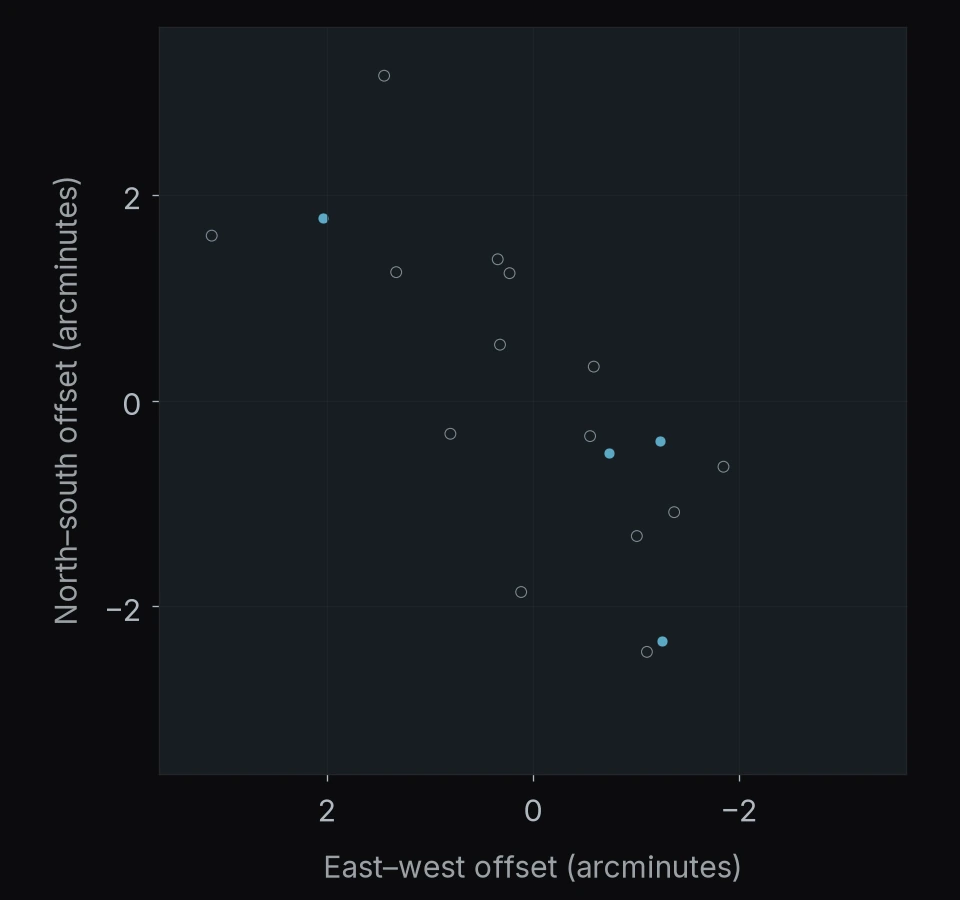
REGION 42 OF 122
POPPIES 03
18 objects
- Watch list18
North is up · east is left.
Axes show angular offsets from the region center.
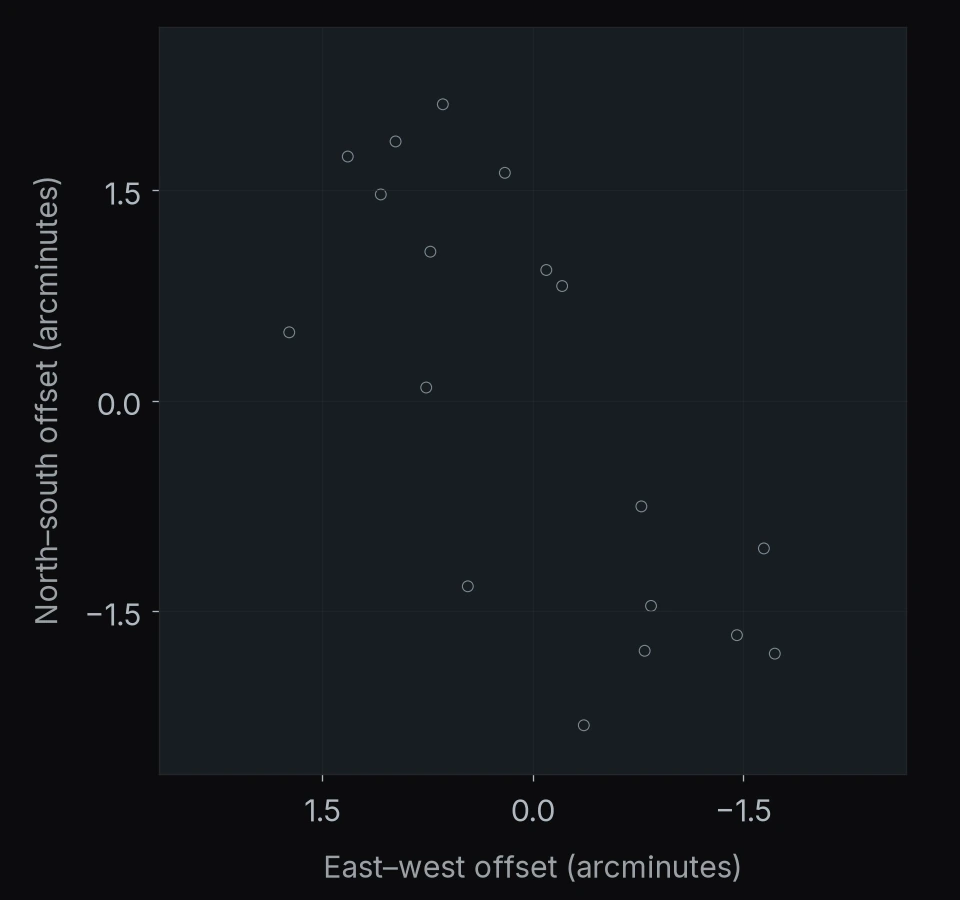
REGION 43 OF 122
SGAS J1050+0017
18 objects
- Watch list17
- Selected after vetting1
North is up · east is left.
Axes show angular offsets from the region center.
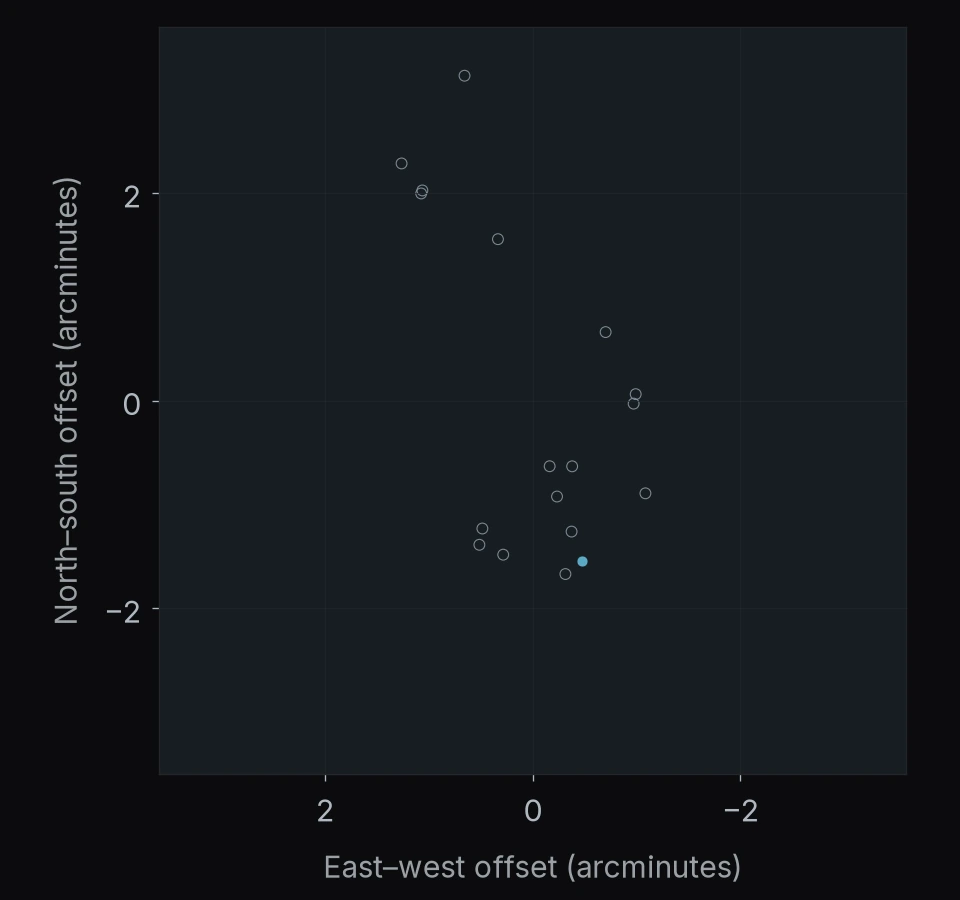
REGION 44 OF 122
SPT-CL J2325-4111
17 objects
- Watch list12
- Selected after vetting5
North is up · east is left.
Axes show angular offsets from the region center.
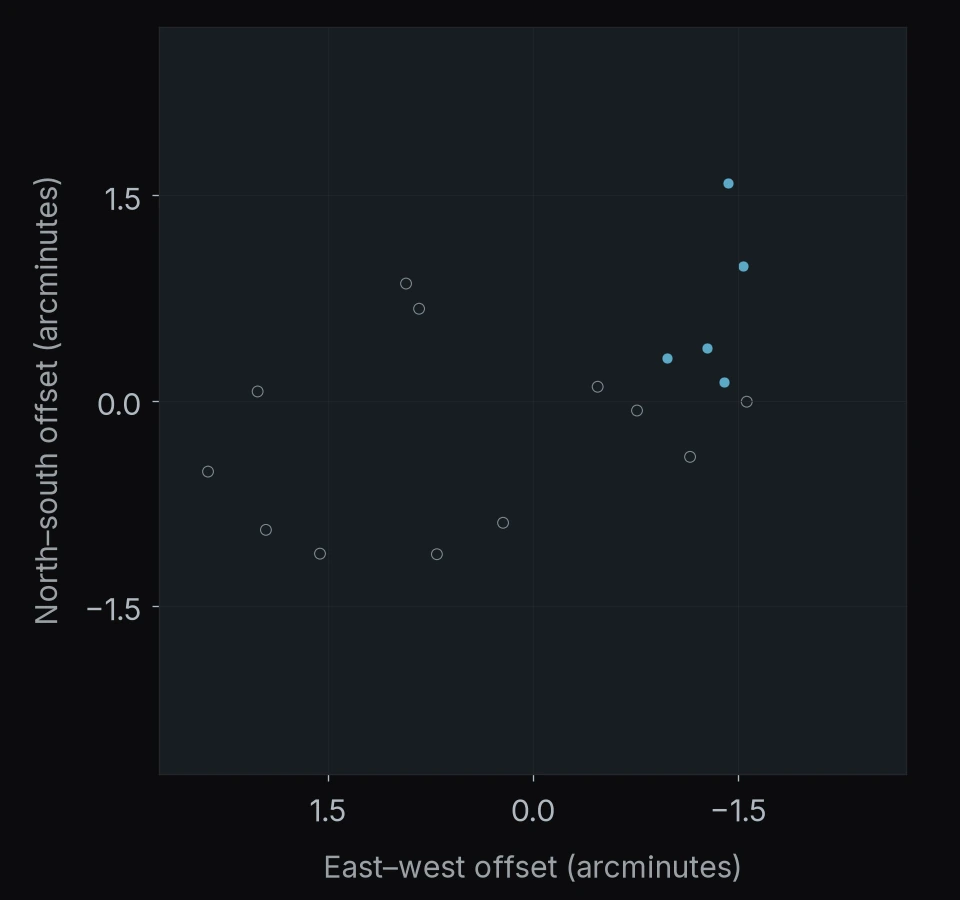
REGION 45 OF 122
El Gordo (ACT-CL J0102-4915)
17 objects
- Watch list13
- Selected after vetting4
North is up · east is left.
Axes show angular offsets from the region center.
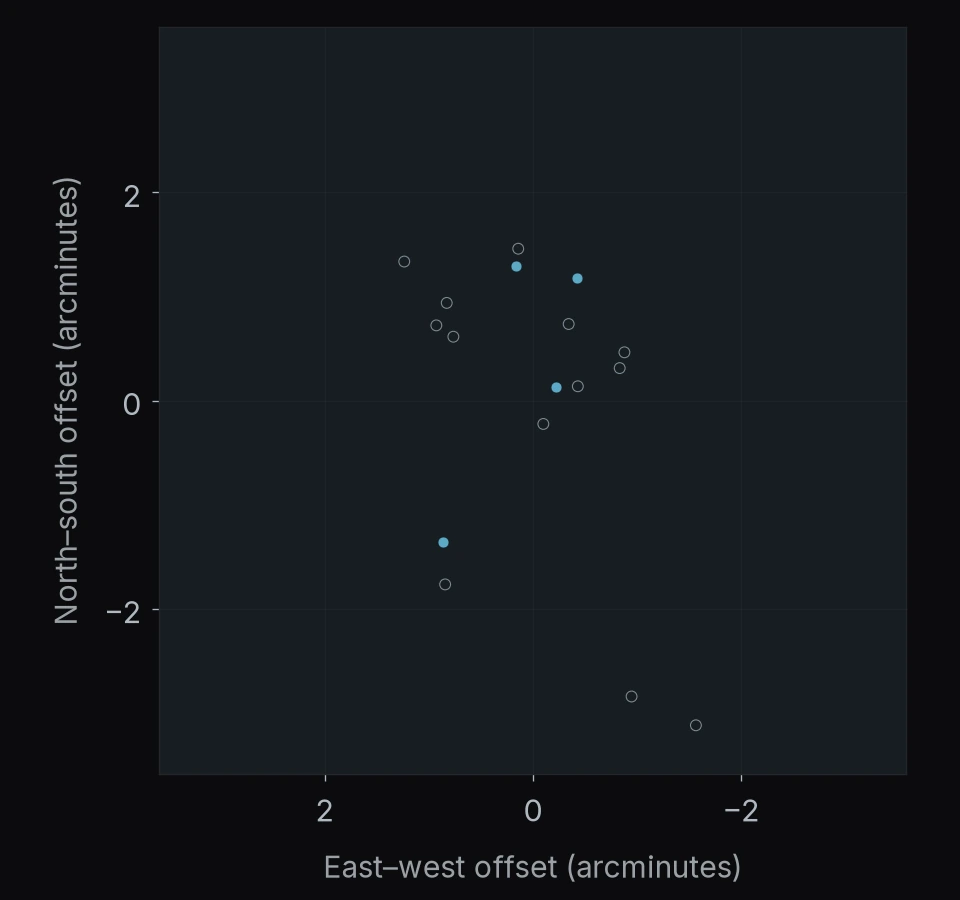
REGION 46 OF 122
RA 160.45° Dec +58.76°
17 objects
- Watch list17
North is up · east is left.
Axes show angular offsets from the region center.
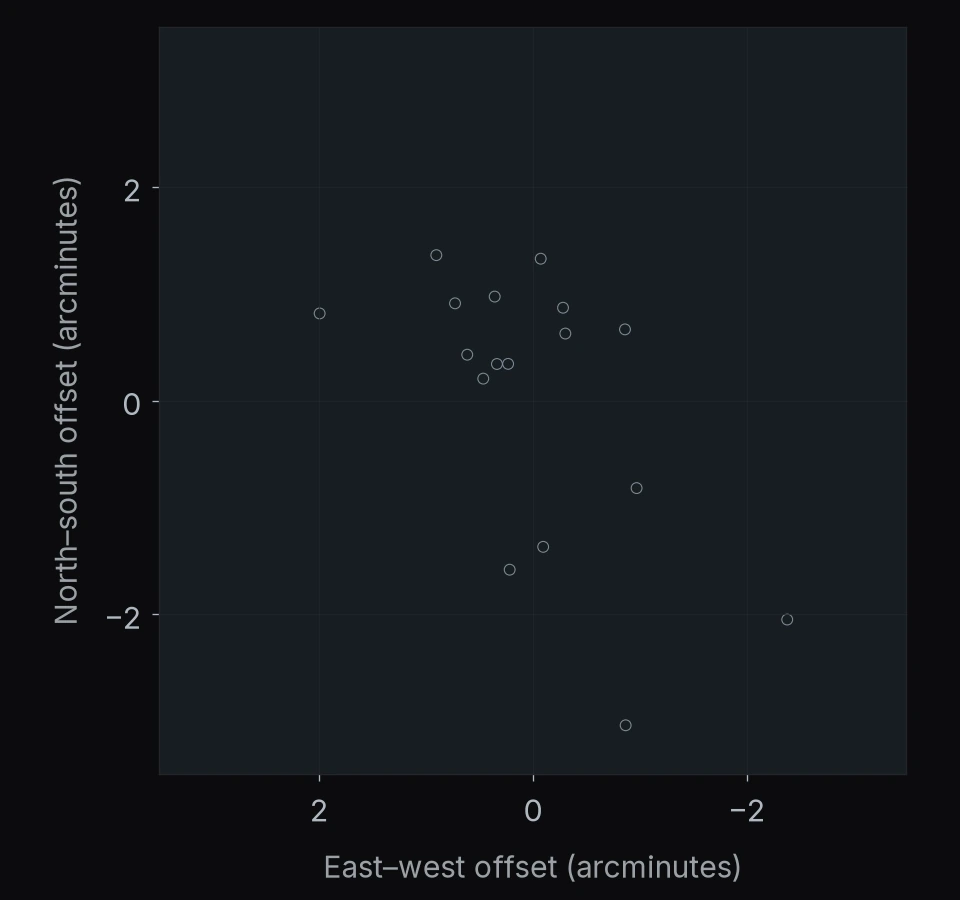
REGION 47 OF 122
SPT-CL J0615-5746
16 objects
- Watch list8
- Selected after vetting8
North is up · east is left.
Axes show angular offsets from the region center.
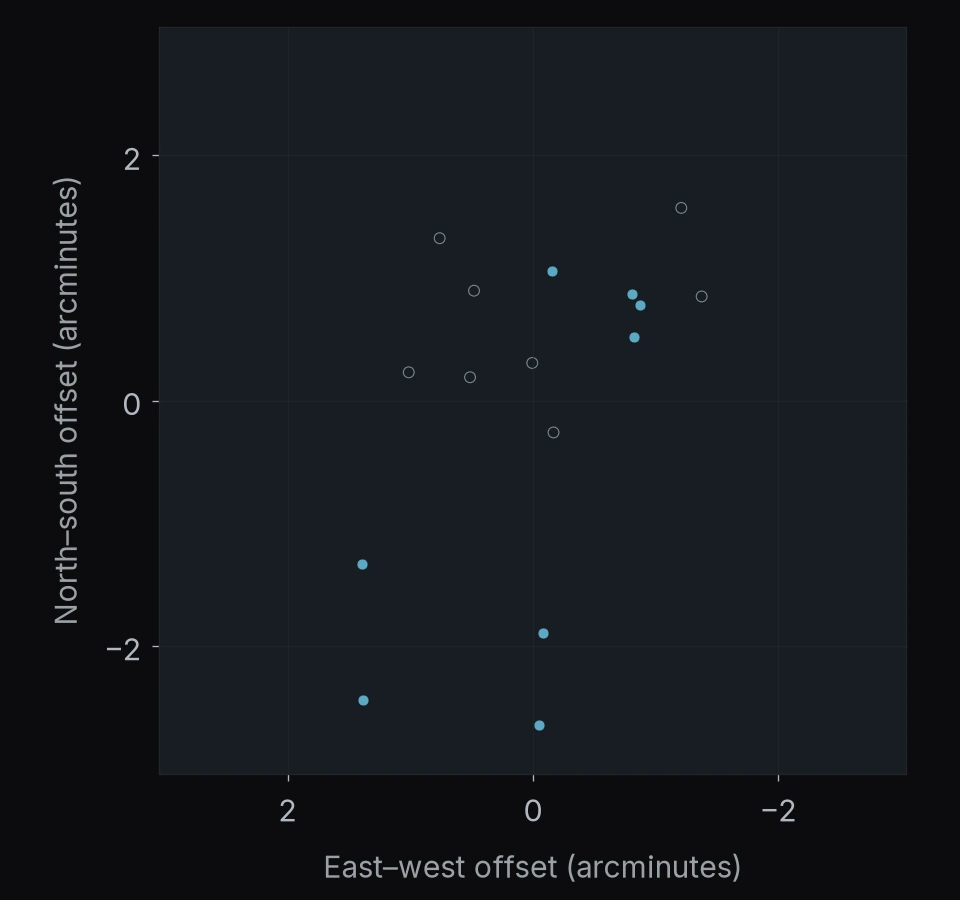
REGION 48 OF 122
RXC J0018.5+1626
16 objects
- Watch list15
- Selected after vetting1
North is up · east is left.
Axes show angular offsets from the region center.
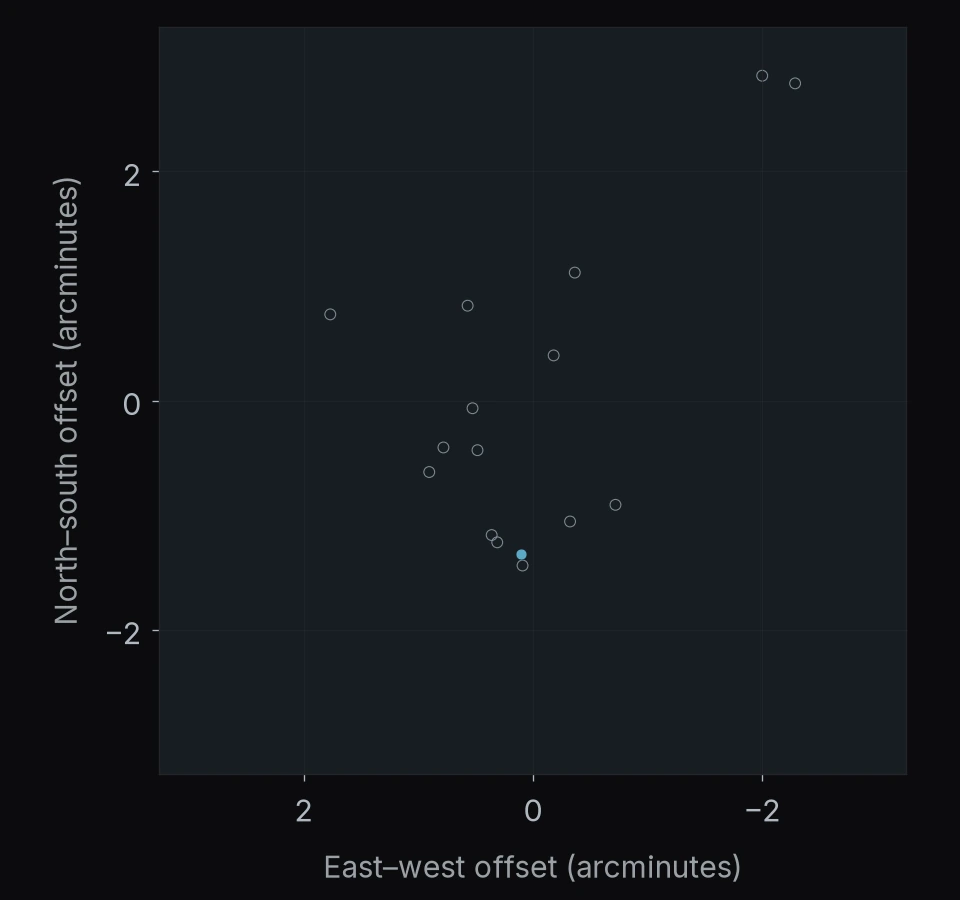
REGION 49 OF 122
POPPIES pointing 105
16 objects
- Watch list9
- Selected after vetting7
North is up · east is left.
Axes show angular offsets from the region center.
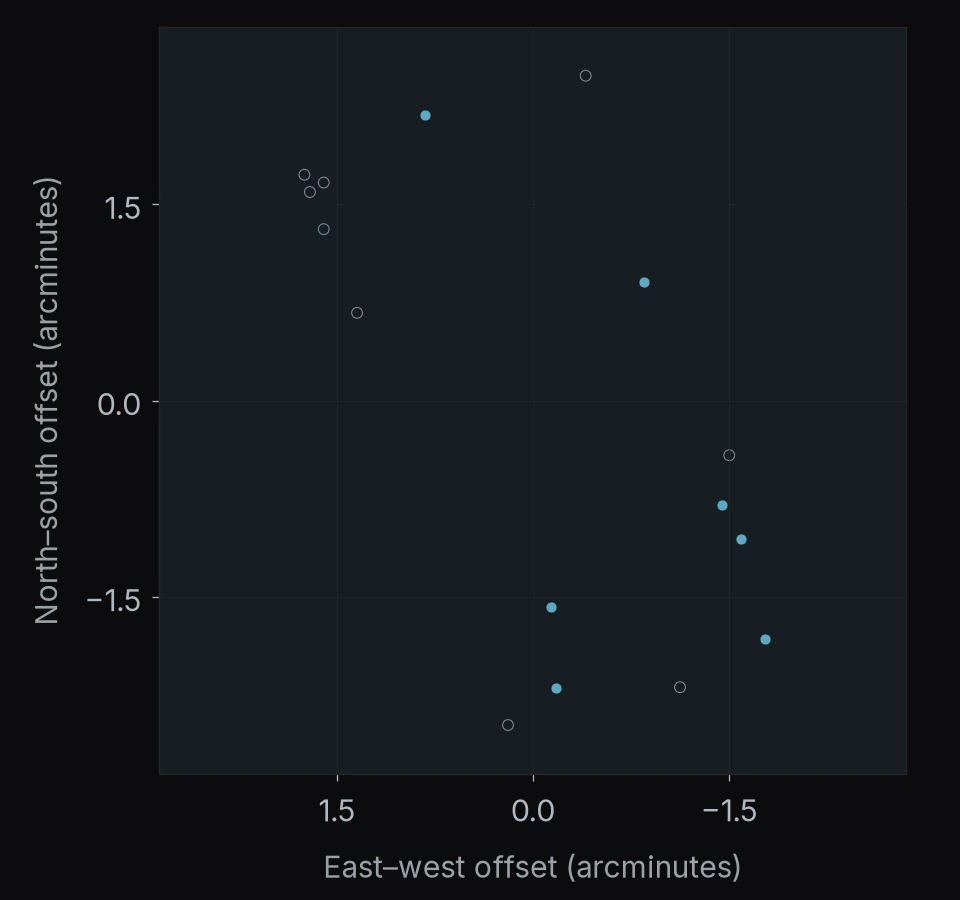
REGION 50 OF 122
RXC J2211.7-0350
15 objects
- Watch list7
- Selected after vetting8
North is up · east is left.
Axes show angular offsets from the region center.
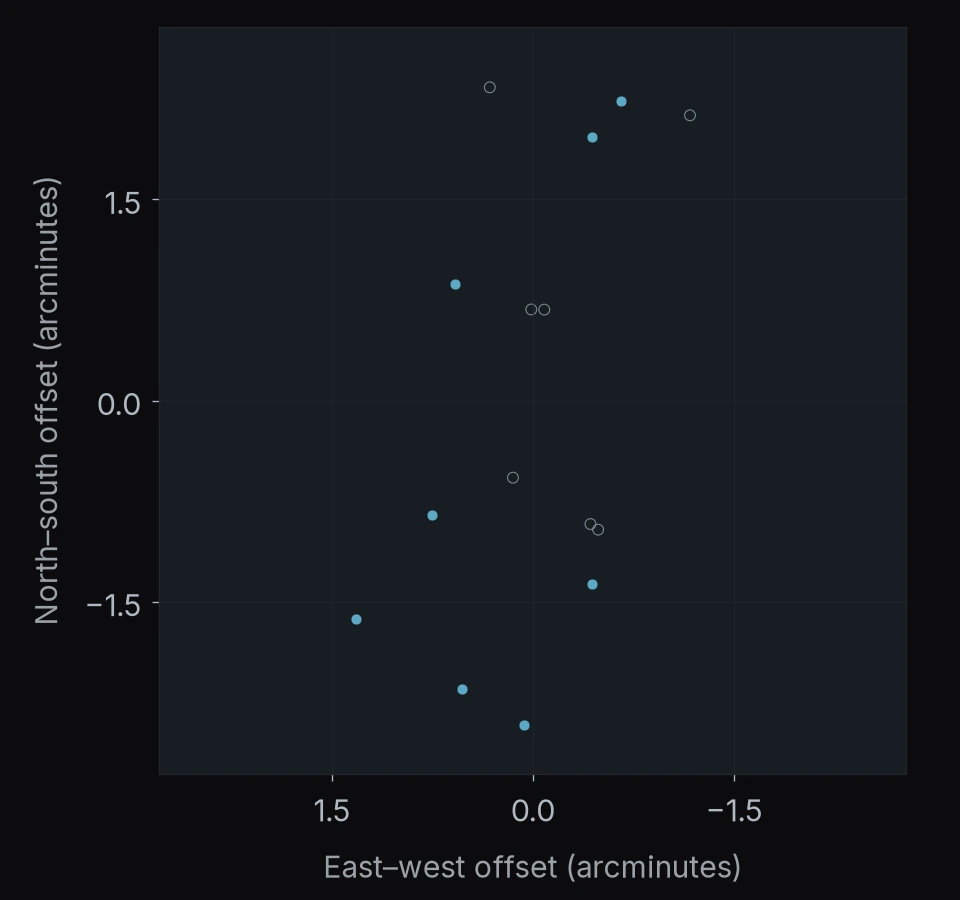
REGION 51 OF 122
Abell S1063
15 objects
- Watch list9
- Selected after vetting4
- Recovered in published JWST catalogs2
North is up · east is left.
Axes show angular offsets from the region center.
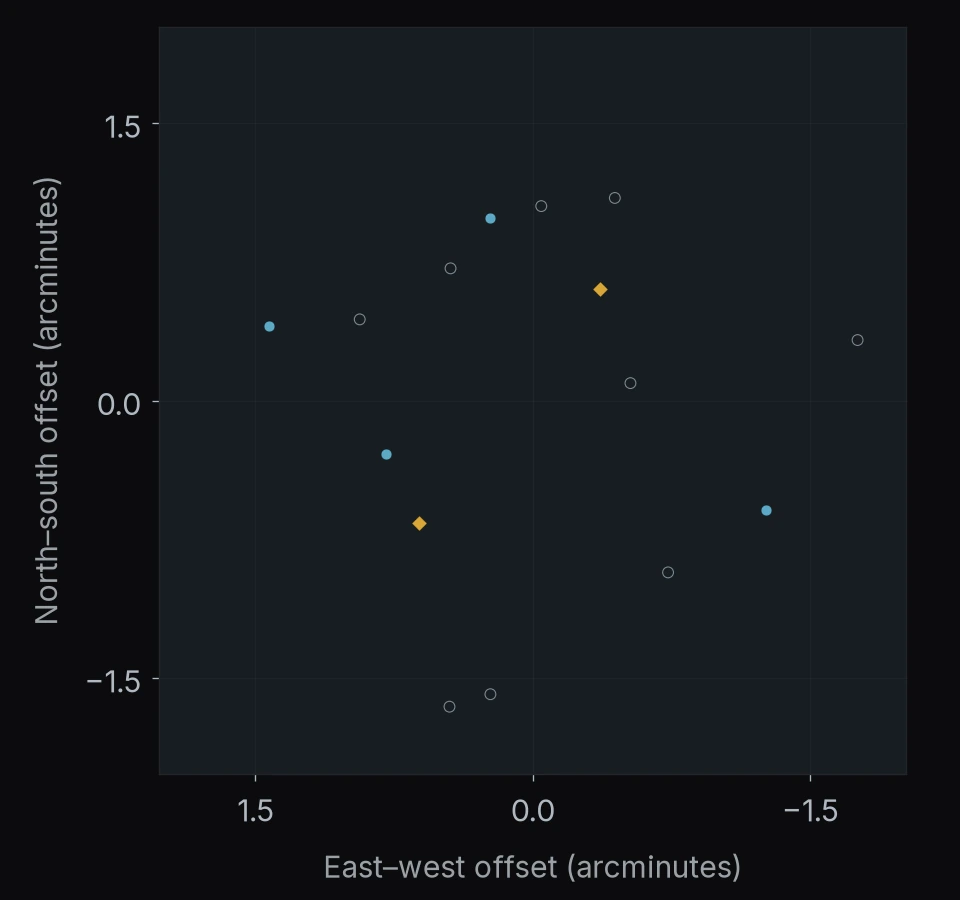
REGION 52 OF 122
WHL0137-08
15 objects
- Watch list10
- Selected after vetting5
North is up · east is left.
Axes show angular offsets from the region center.
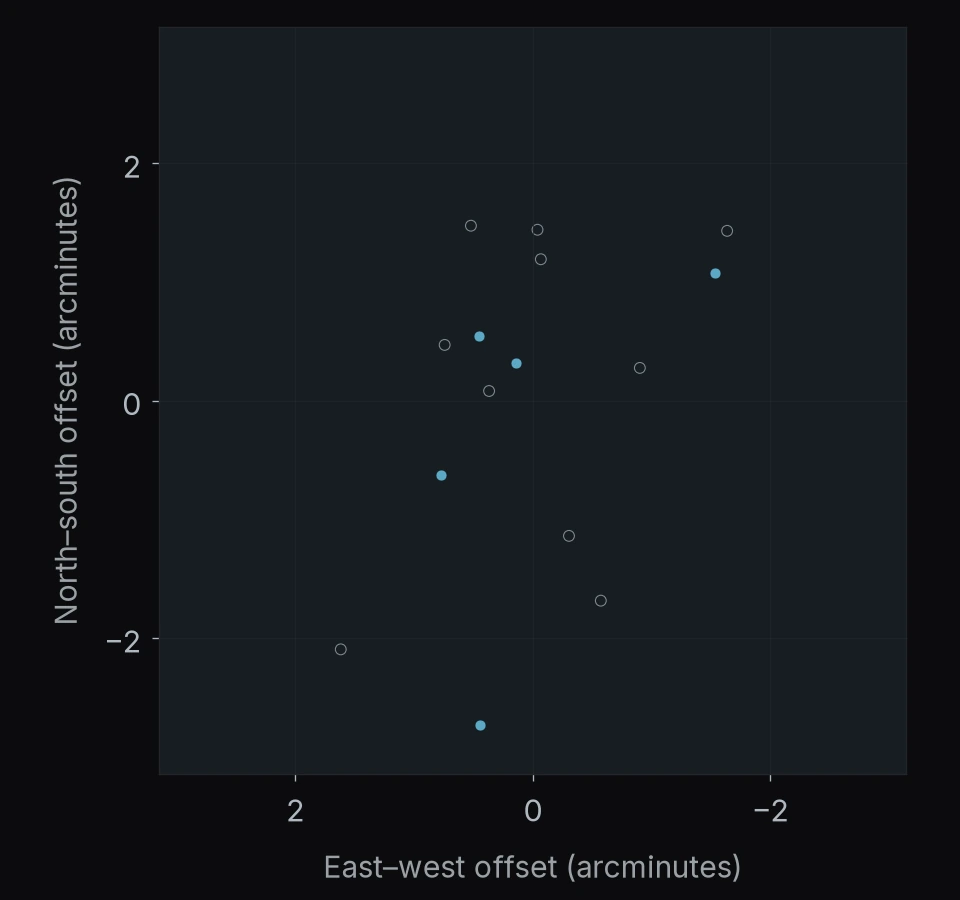
REGION 53 OF 122
MACS J1931.8-2635
14 objects
- Watch list10
- Selected after vetting4
North is up · east is left.
Axes show angular offsets from the region center.
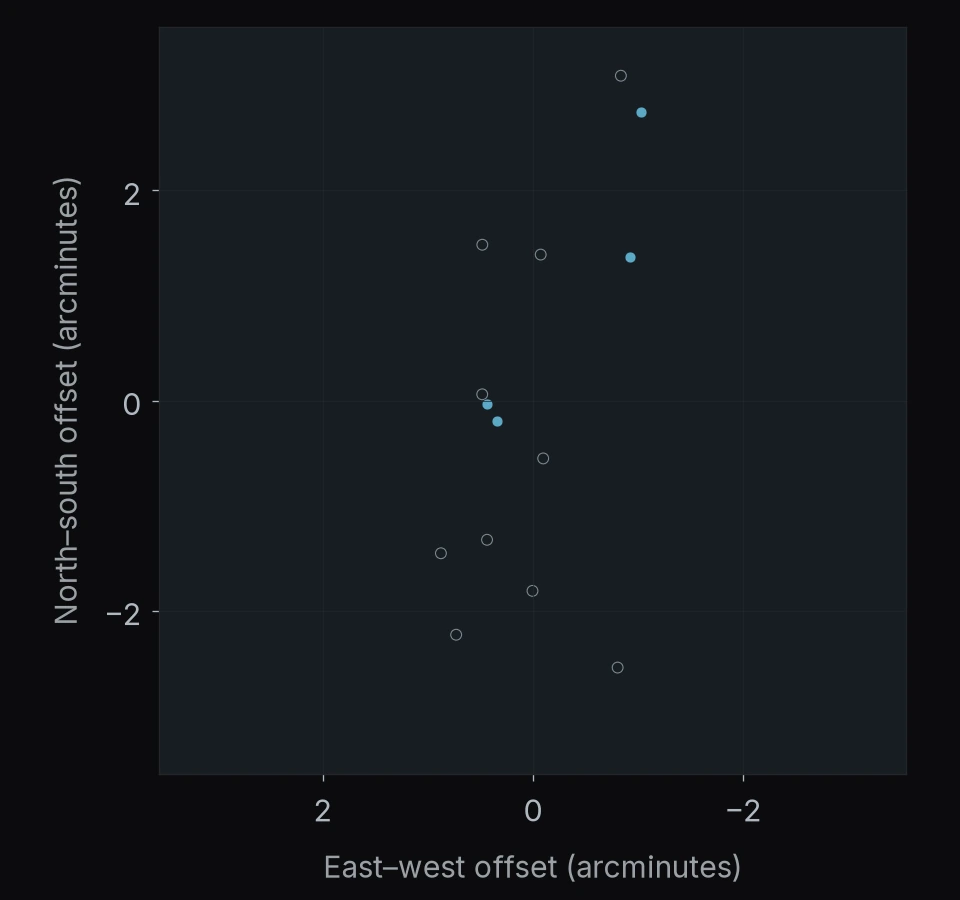
REGION 54 OF 122
MACS J0257.6-2209
14 objects
- Watch list10
- Selected after vetting4
North is up · east is left.
Axes show angular offsets from the region center.
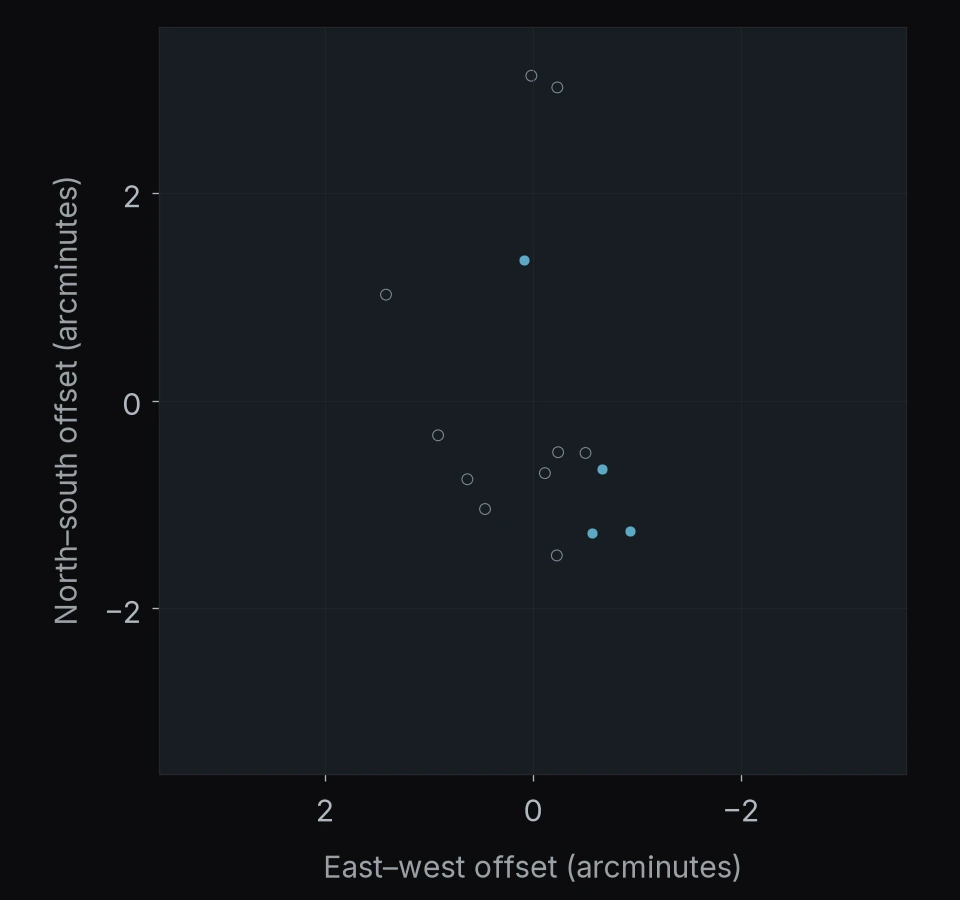
REGION 55 OF 122
Abell 3192
14 objects
- Watch list12
- Selected after vetting2
North is up · east is left.
Axes show angular offsets from the region center.
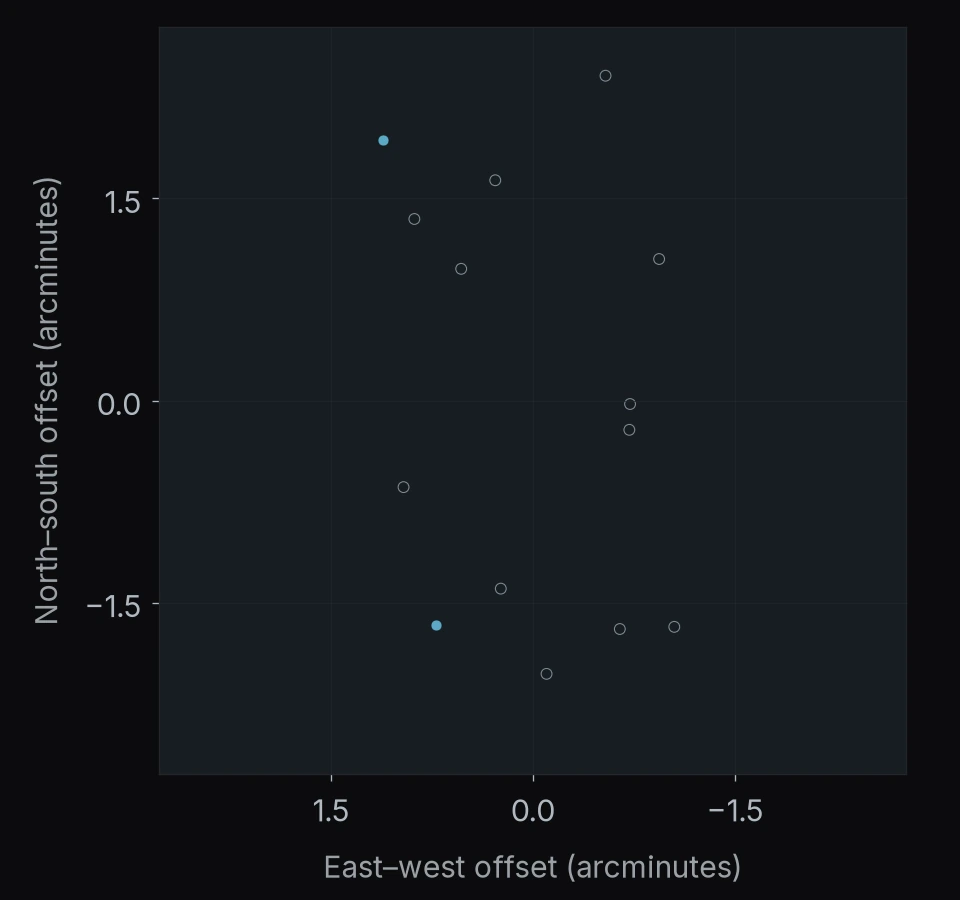
REGION 56 OF 122
Abell S295
14 objects
- Watch list9
- Selected after vetting5
North is up · east is left.
Axes show angular offsets from the region center.
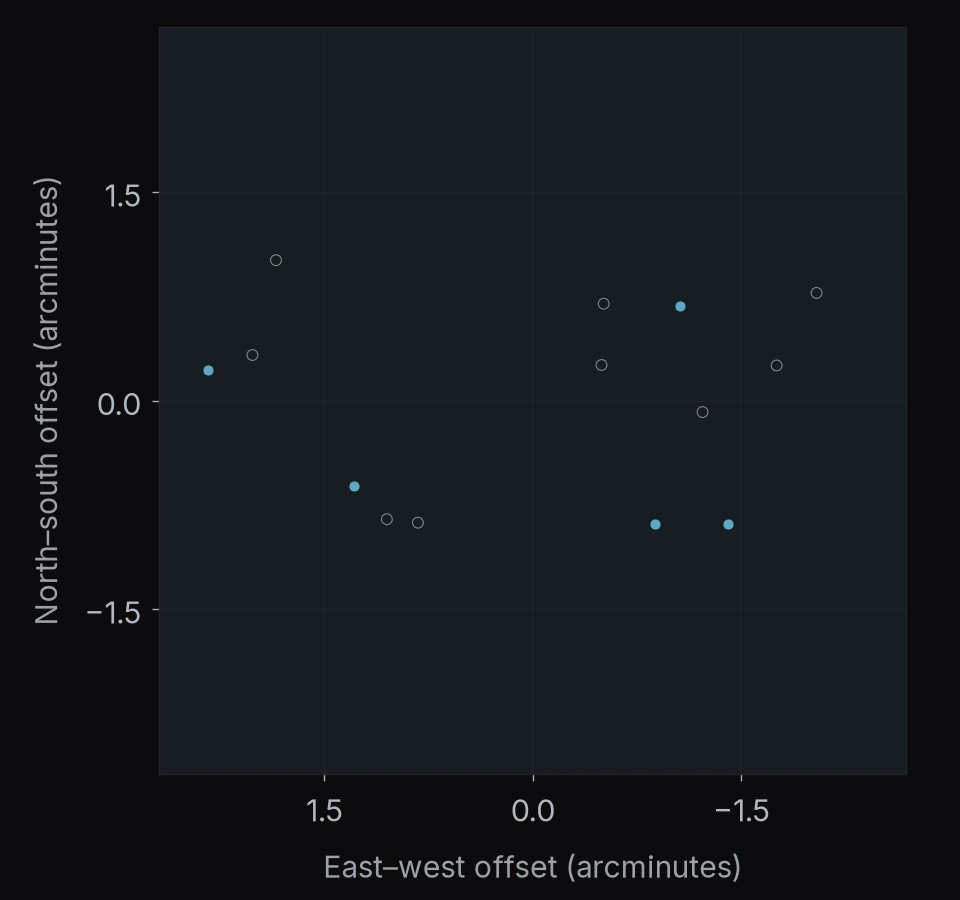
REGION 57 OF 122
BDF-3299
14 objects
- Watch list11
- Selected after vetting3
North is up · east is left.
Axes show angular offsets from the region center.
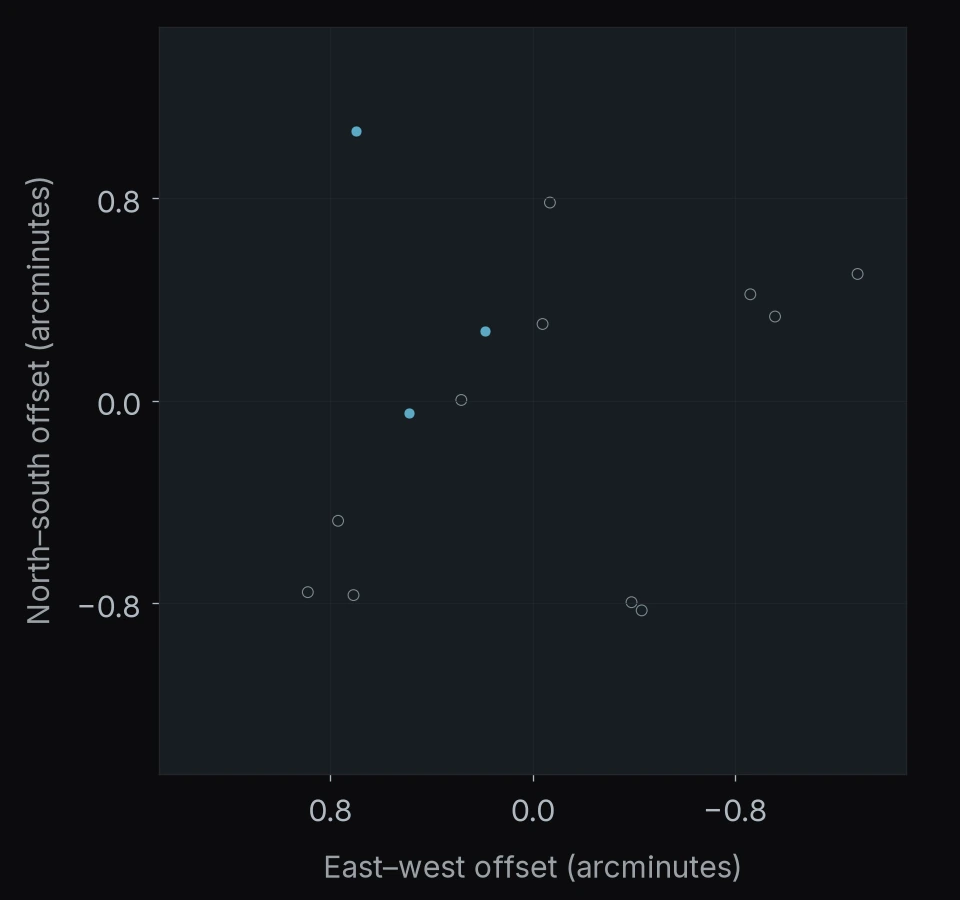
REGION 58 OF 122
SGAS J1110+6459
14 objects
- Watch list12
- Selected after vetting2
North is up · east is left.
Axes show angular offsets from the region center.
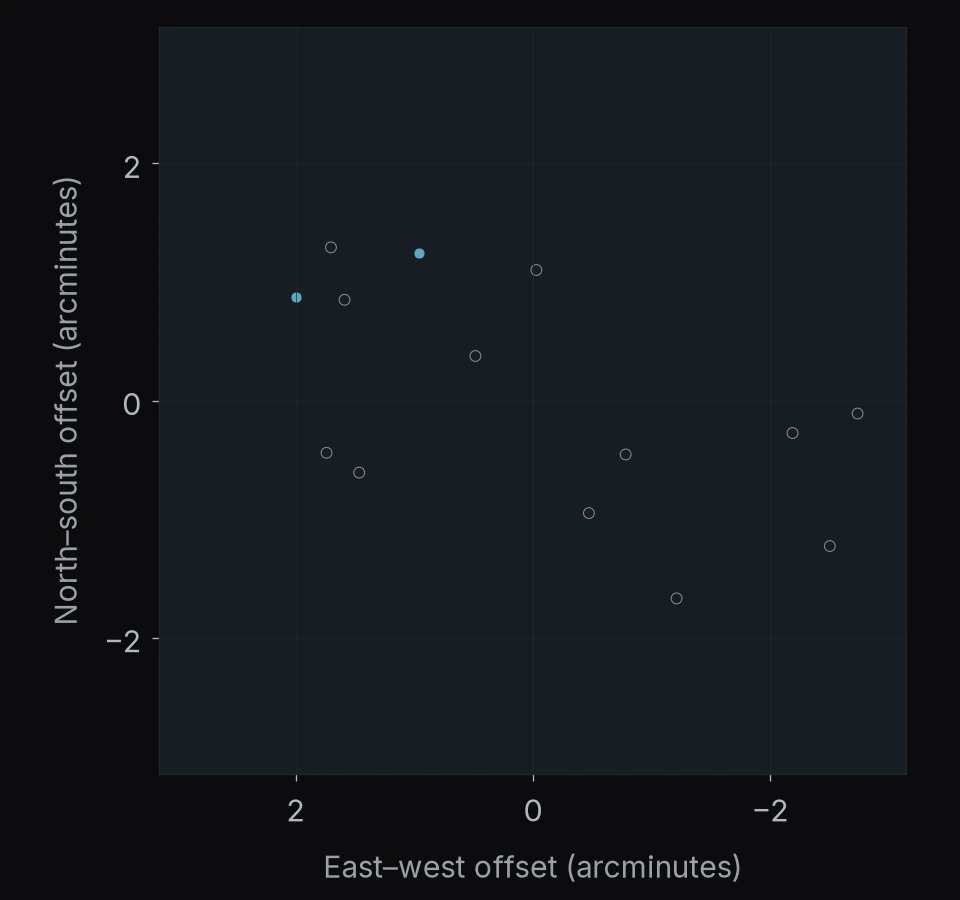
REGION 59 OF 122
PANORAMIC J043844-6849
13 objects
- Watch list5
- Selected after vetting2
- Recovered in published JWST catalogs6
North is up · east is left.
Axes show angular offsets from the region center.
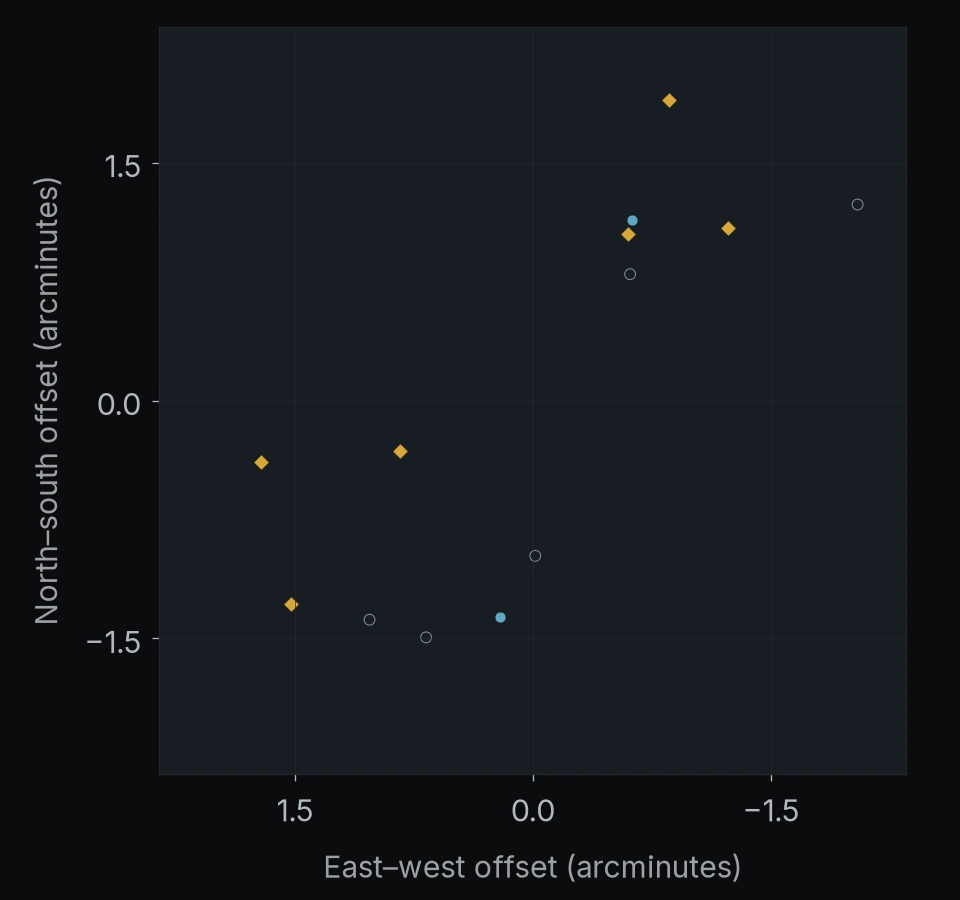
REGION 60 OF 122
Abell 2537
13 objects
- Watch list10
- Selected after vetting3
North is up · east is left.
Axes show angular offsets from the region center.
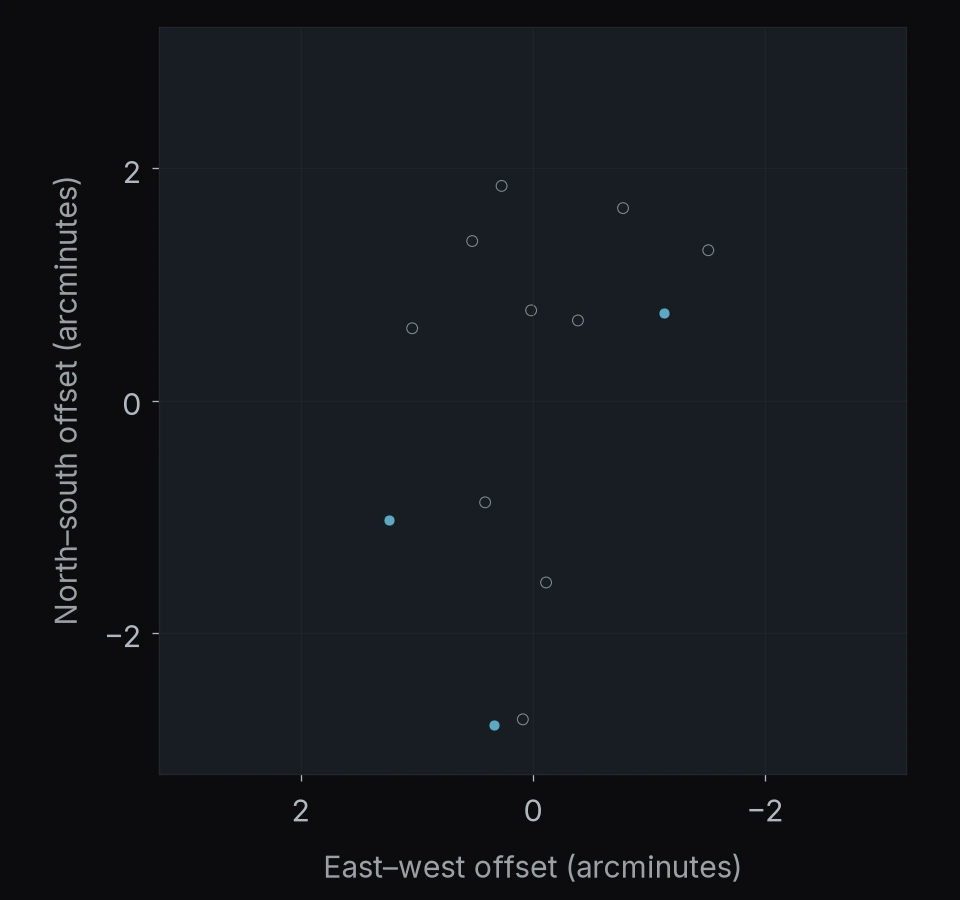
REGION 61 OF 122
Abell 383
13 objects
- Watch list11
- Selected after vetting2
North is up · east is left.
Axes show angular offsets from the region center.
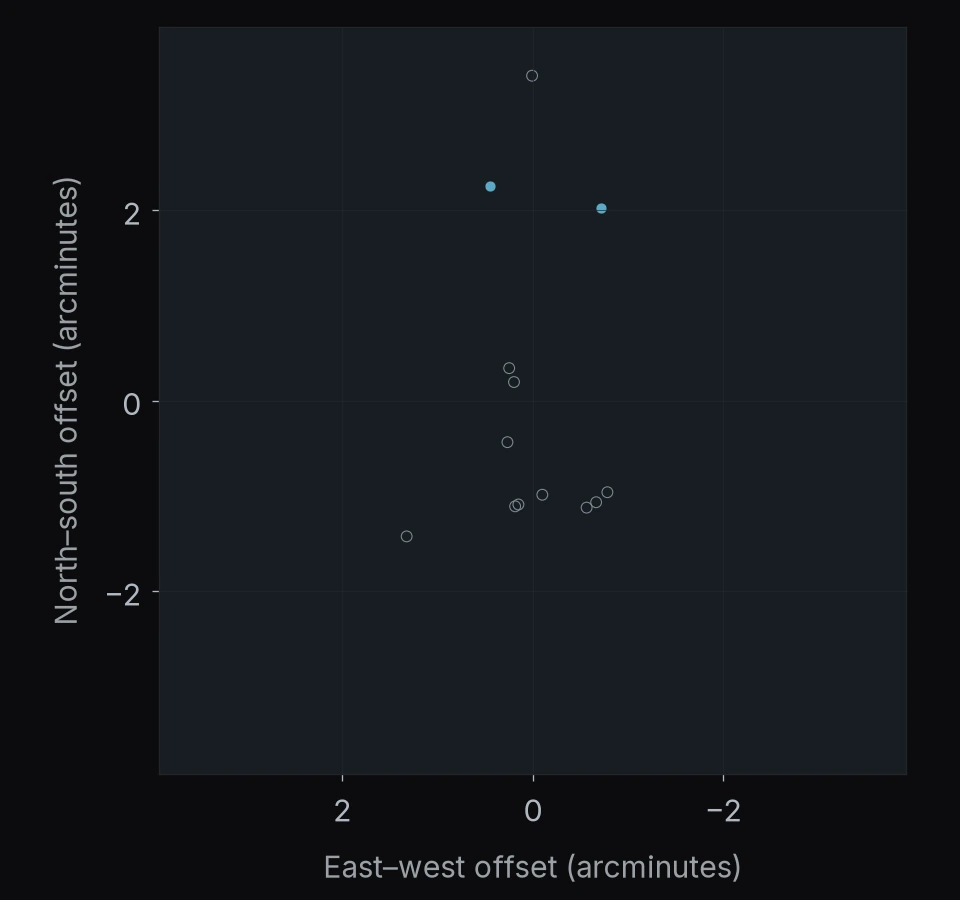
REGION 62 OF 122
Abell 209
13 objects
- Watch list6
- Selected after vetting7
North is up · east is left.
Axes show angular offsets from the region center.
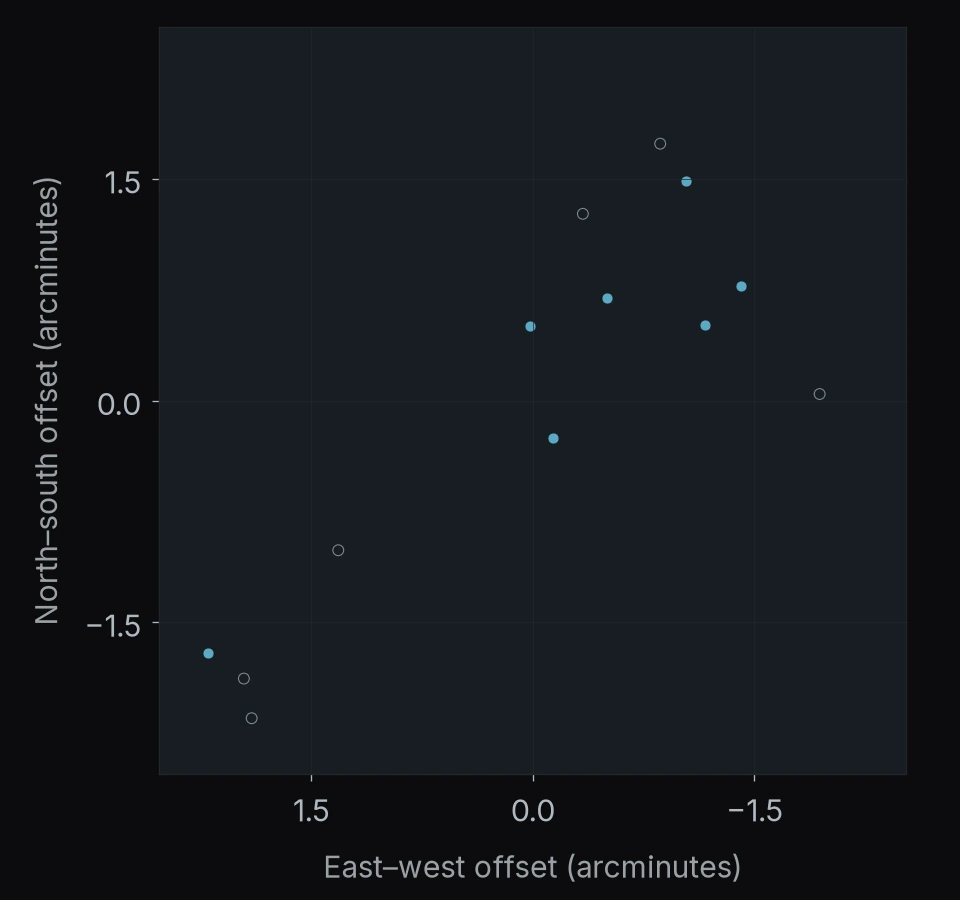
REGION 63 OF 122
Bullet Cluster (1E 0657-56)
12 objects
- Watch list6
- Selected after vetting6
North is up · east is left.
Axes show angular offsets from the region center.
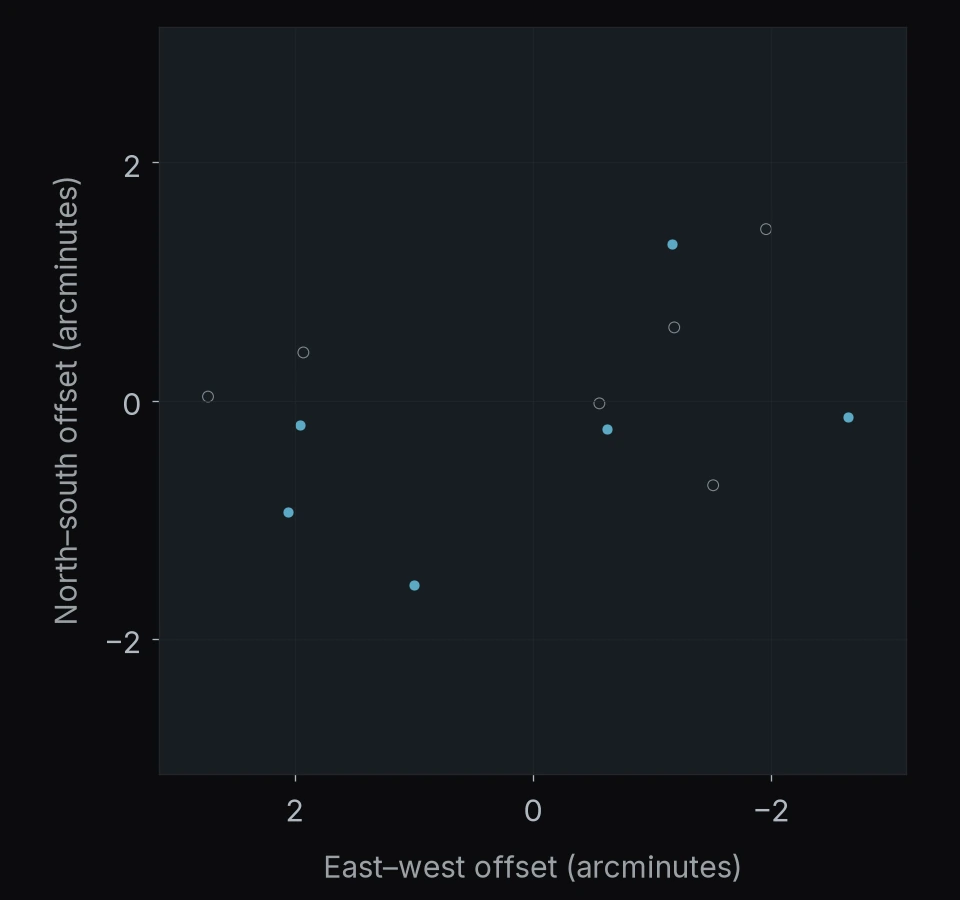
REGION 64 OF 122
MACS J0308.9+2645
12 objects
- Watch list7
- Selected after vetting5
North is up · east is left.
Axes show angular offsets from the region center.
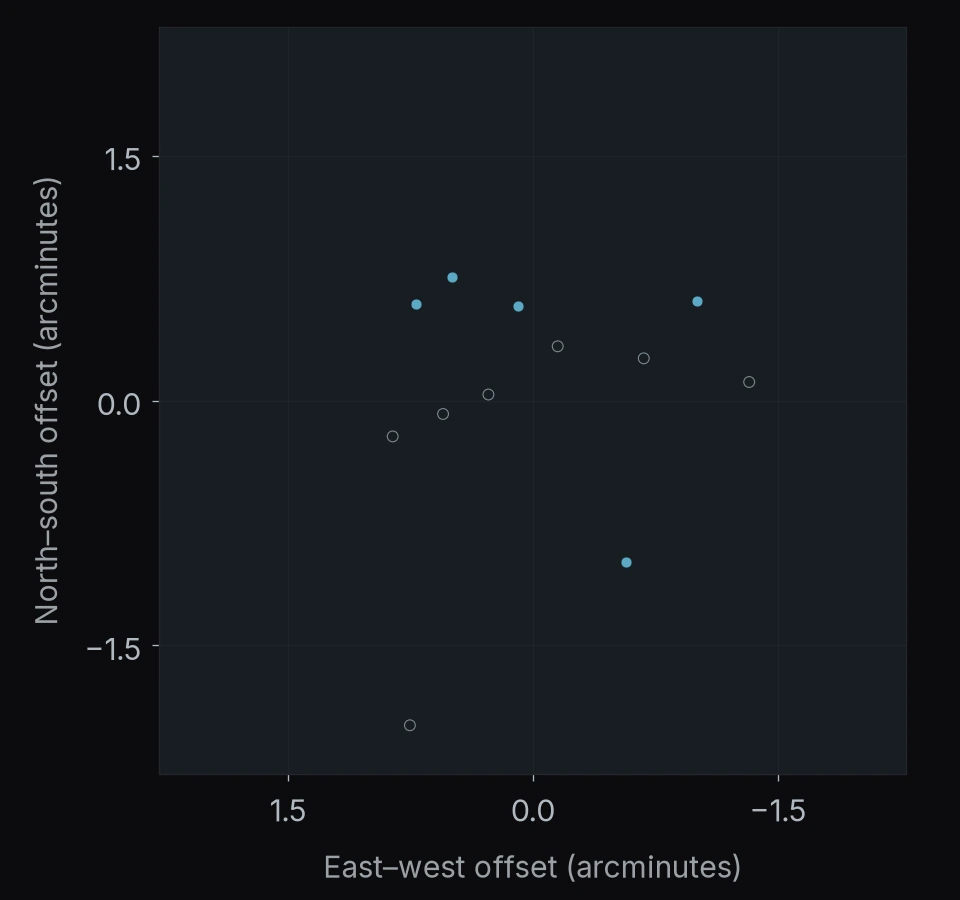
REGION 65 OF 122
PLCK G004.5-19.5
12 objects
- Watch list9
- Selected after vetting3
North is up · east is left.
Axes show angular offsets from the region center.
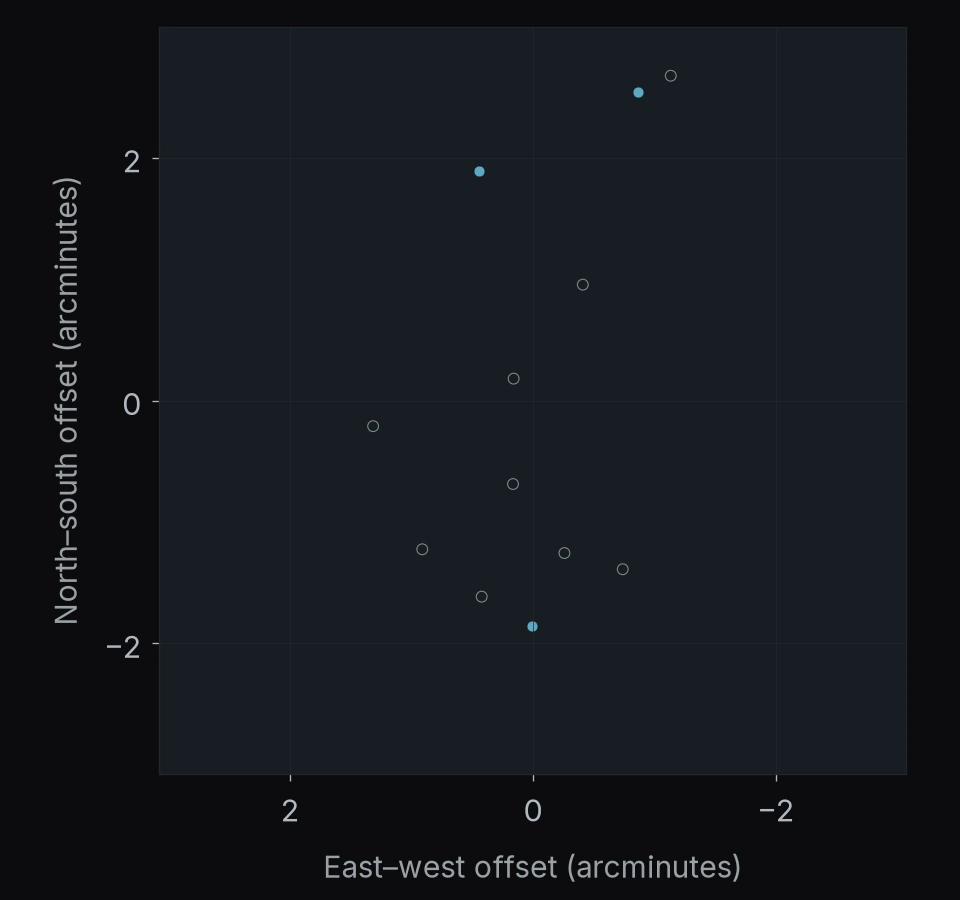
REGION 66 OF 122
PANORAMIC J000352-1120
12 objects
- Watch list9
- Selected after vetting1
- Recovered in published JWST catalogs2
North is up · east is left.
Axes show angular offsets from the region center.
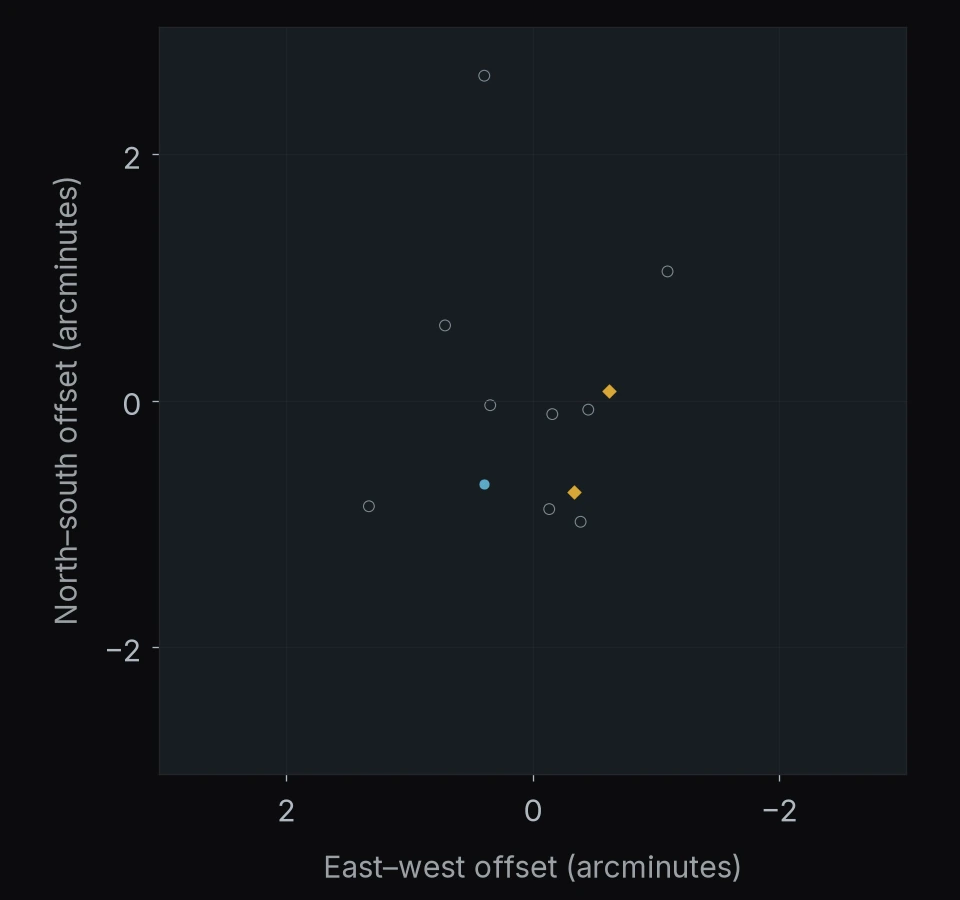
REGION 67 OF 122
RXC J0911.1+1746
12 objects
- Watch list10
- Selected after vetting2
North is up · east is left.
Axes show angular offsets from the region center.
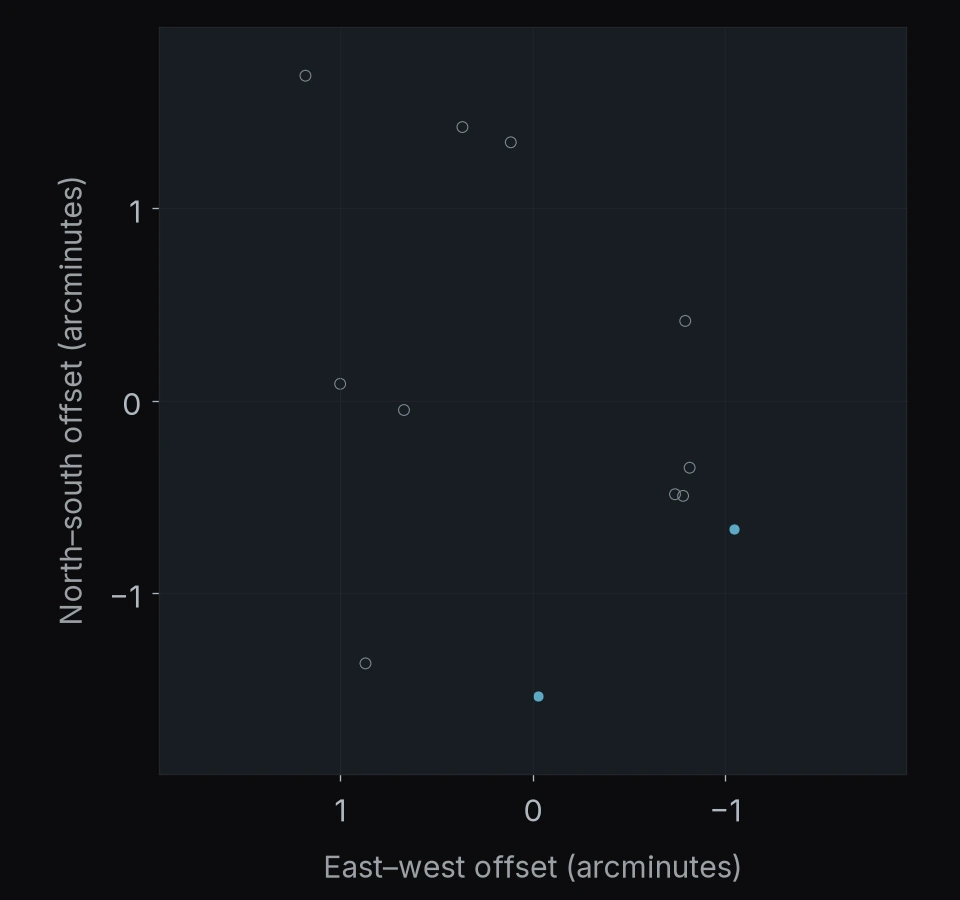
REGION 68 OF 122
MACS J0940.9+0744
12 objects
- Watch list9
- Selected after vetting3
North is up · east is left.
Axes show angular offsets from the region center.
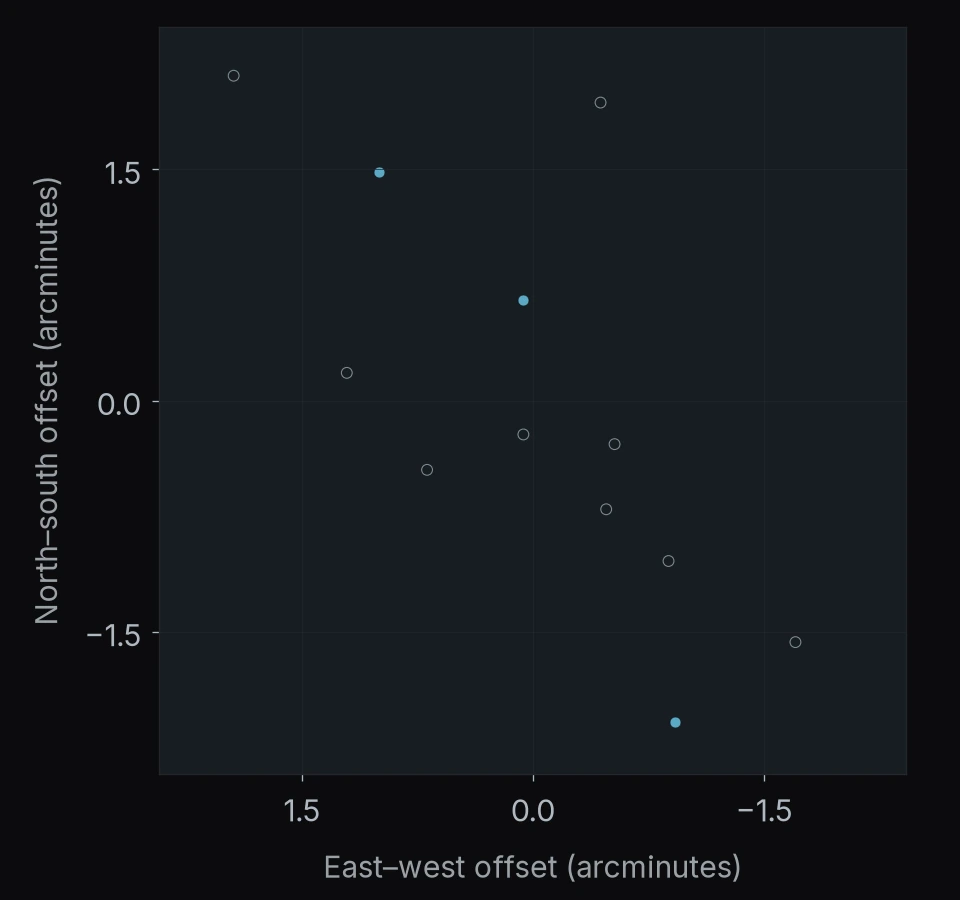
REGION 69 OF 122
PANORAMIC J131432+2432
12 objects
- Watch list11
- Recovered in published JWST catalogs1
North is up · east is left.
Axes show angular offsets from the region center.
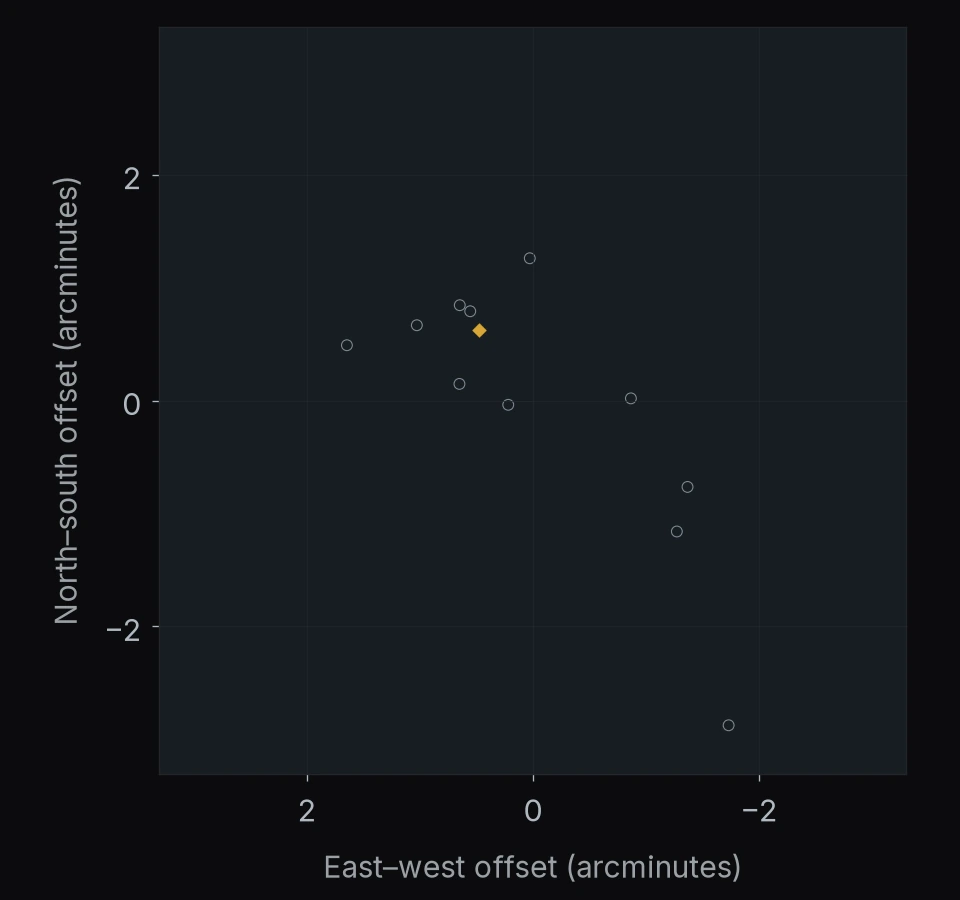
REGION 70 OF 122
MACS J1206.2-0847
12 objects
- Watch list10
- Selected after vetting2
North is up · east is left.
Axes show angular offsets from the region center.
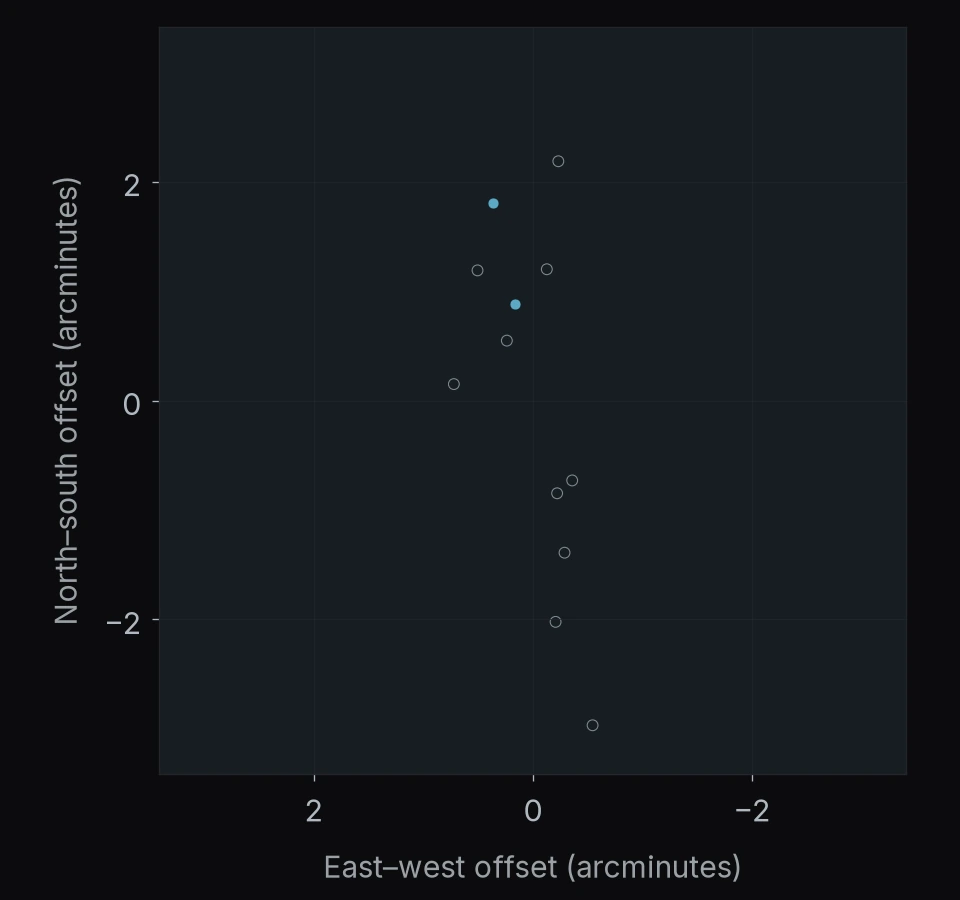
REGION 71 OF 122
PANORAMIC J130016+1215
12 objects
- Watch list7
- Selected after vetting4
- Recovered in published JWST catalogs1
North is up · east is left.
Axes show angular offsets from the region center.
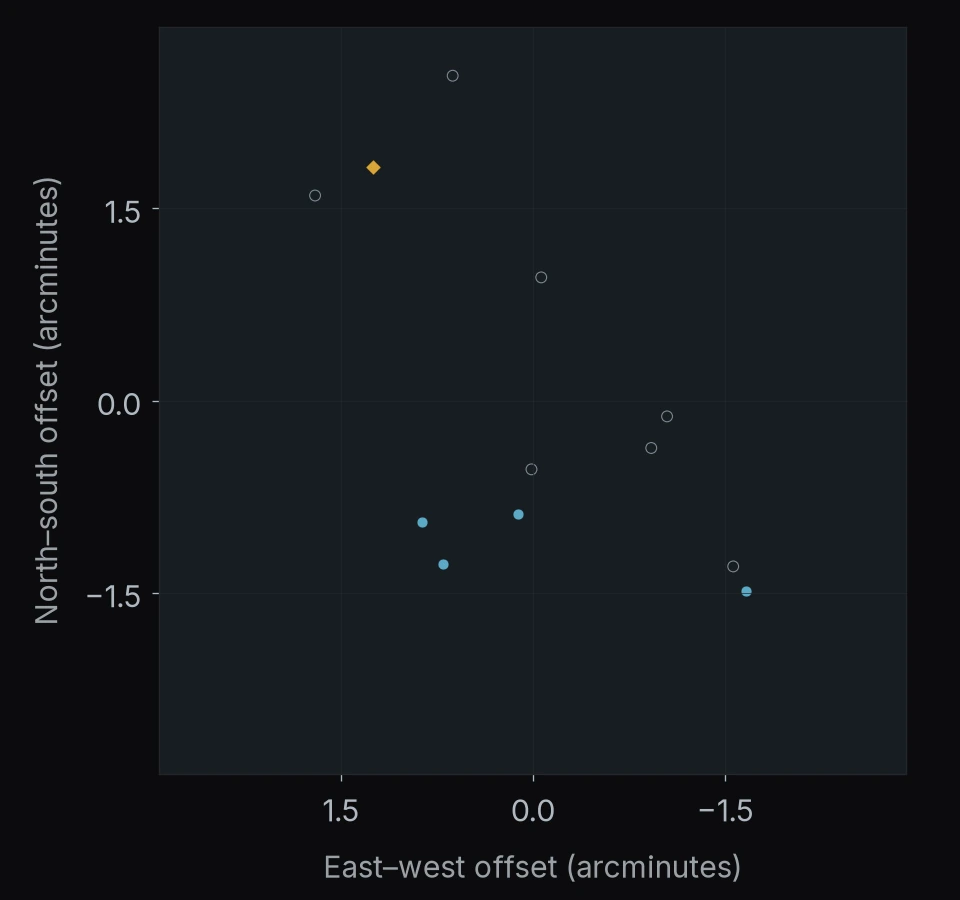
REGION 72 OF 122
RXC J0232.2-4420
11 objects
- Watch list7
- Selected after vetting4
North is up · east is left.
Axes show angular offsets from the region center.
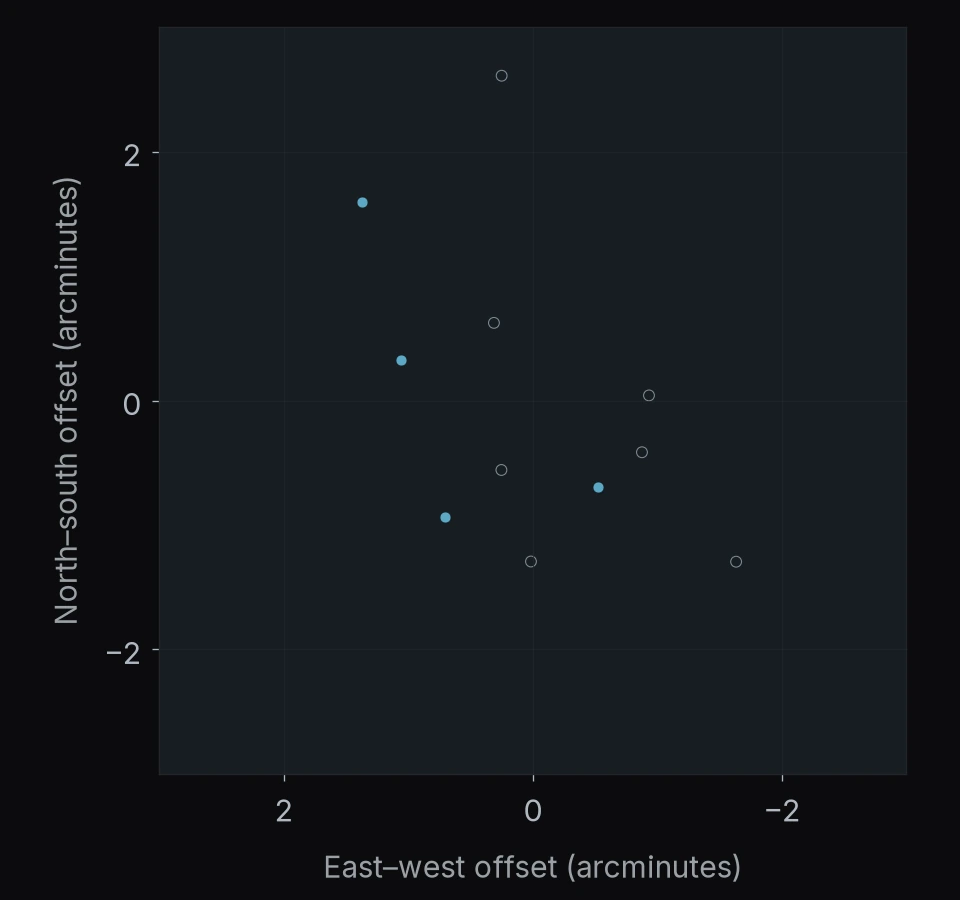
REGION 73 OF 122
Abell 2813
11 objects
- Watch list7
- Selected after vetting4
North is up · east is left.
Axes show angular offsets from the region center.
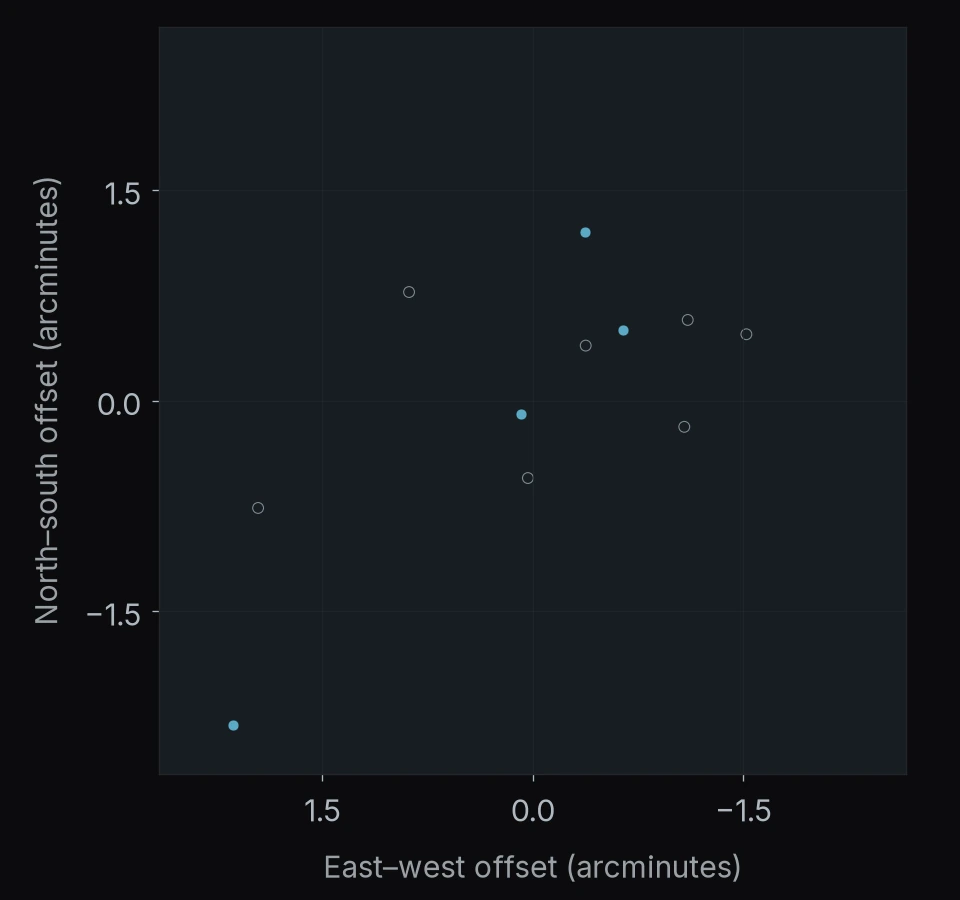
REGION 74 OF 122
MACS J0329.6-0211
11 objects
- Watch list9
- Selected after vetting2
North is up · east is left.
Axes show angular offsets from the region center.
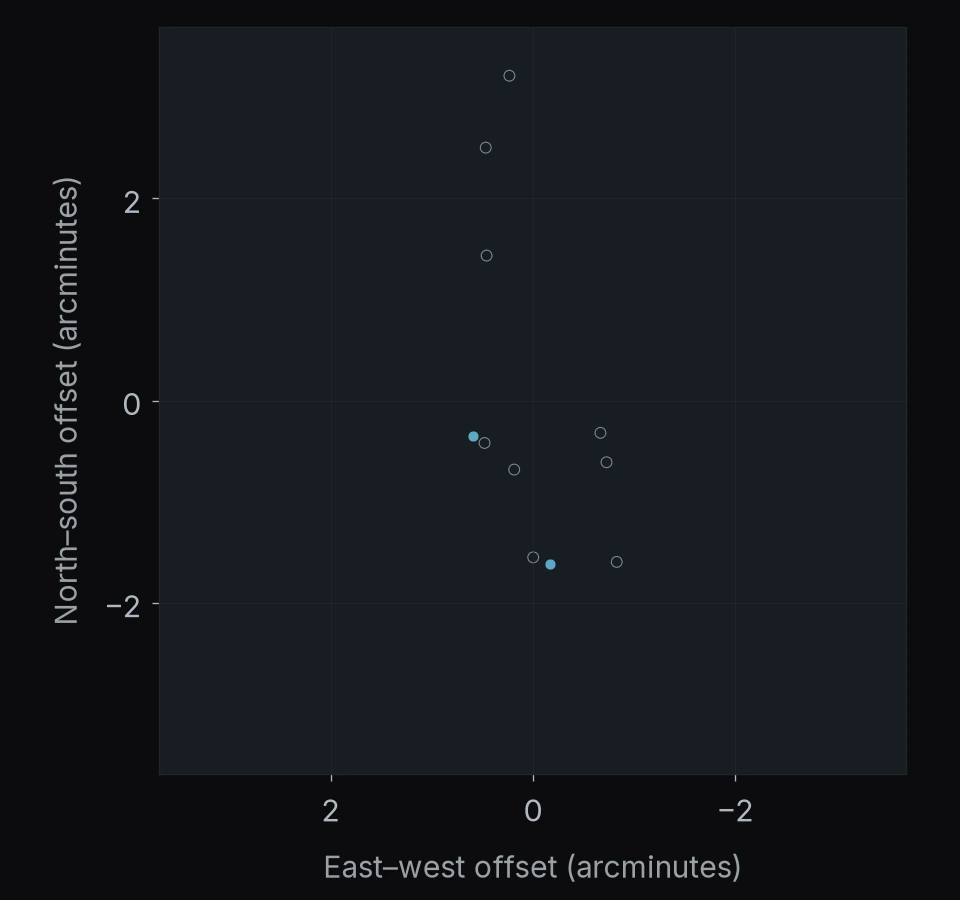
REGION 75 OF 122
POPPIES 02
11 objects
- Watch list11
North is up · east is left.
Axes show angular offsets from the region center.
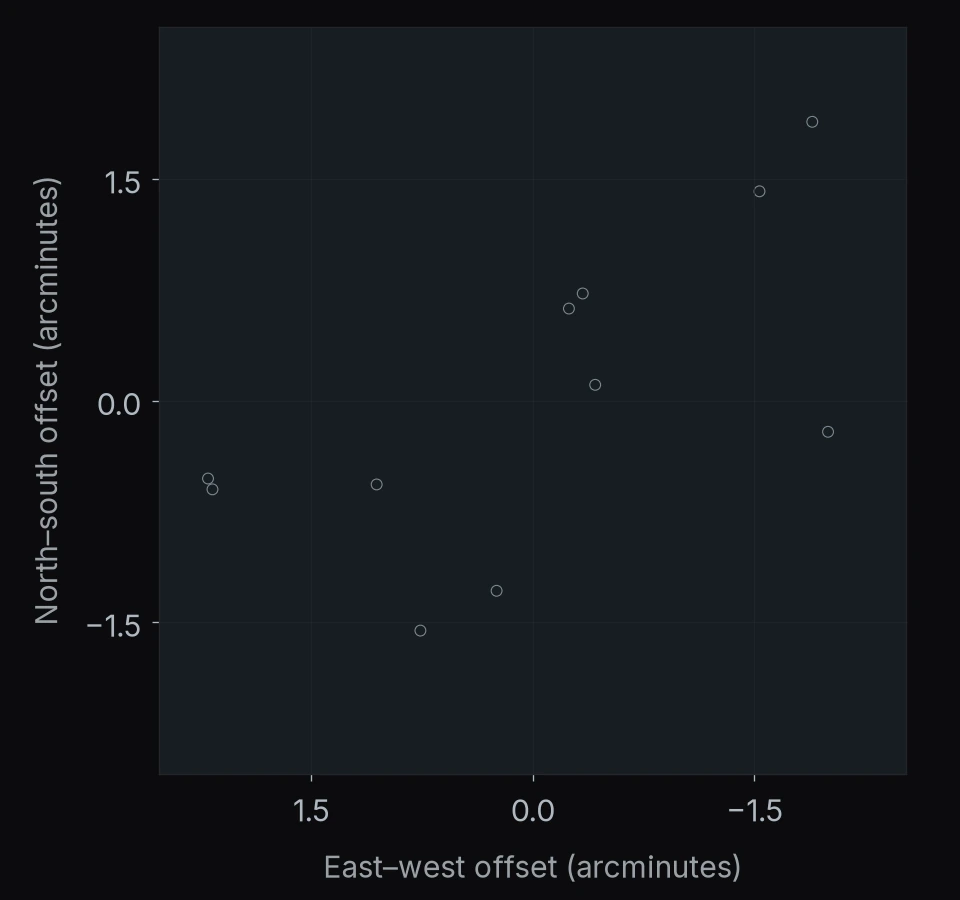
REGION 76 OF 122
PANORAMIC J100736+2109
11 objects
- Watch list6
- Selected after vetting1
- Recovered in published JWST catalogs4
North is up · east is left.
Axes show angular offsets from the region center.
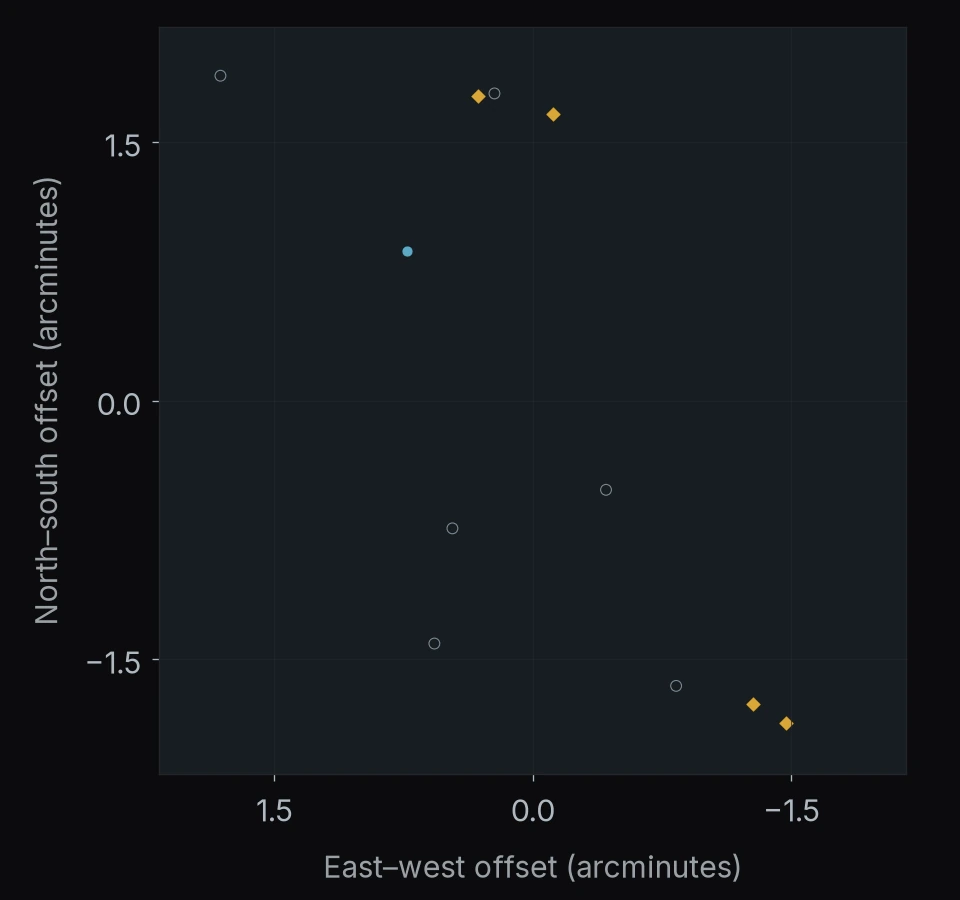
REGION 77 OF 122
PANORAMIC J093144+0819
11 objects
- Watch list7
- Selected after vetting4
North is up · east is left.
Axes show angular offsets from the region center.
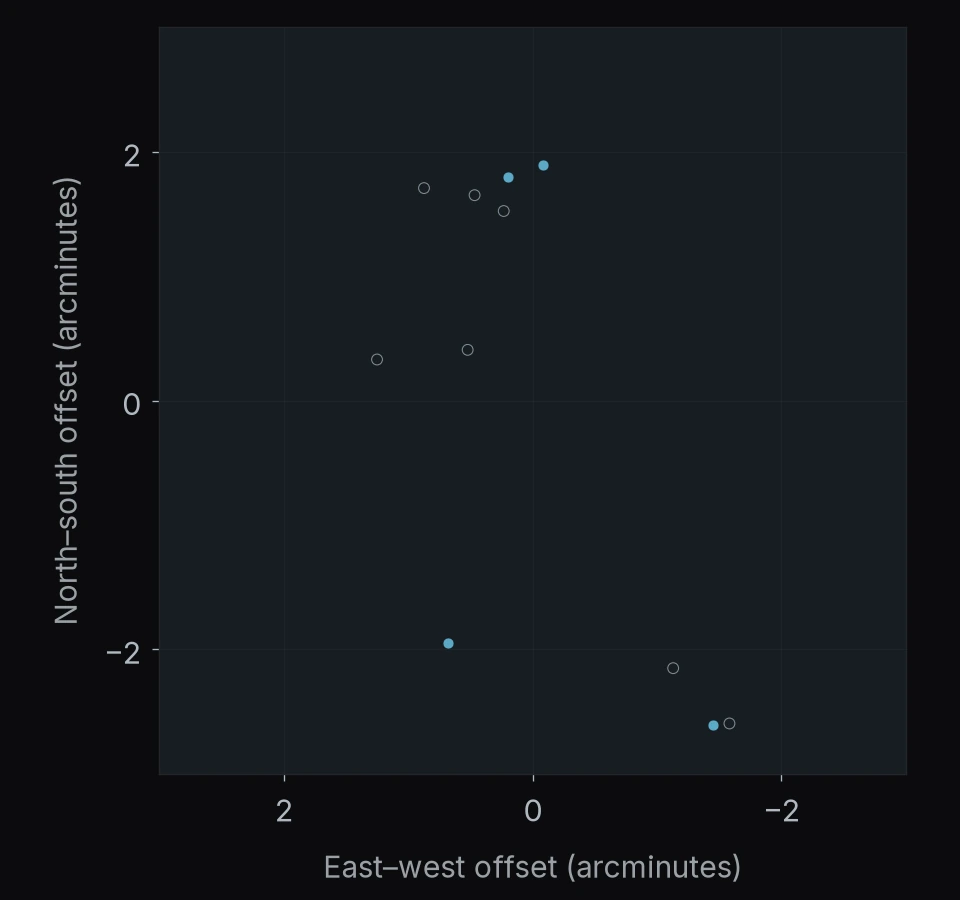
REGION 78 OF 122
MACS J2214.9-1359
10 objects
- Watch list6
- Selected after vetting4
North is up · east is left.
Axes show angular offsets from the region center.
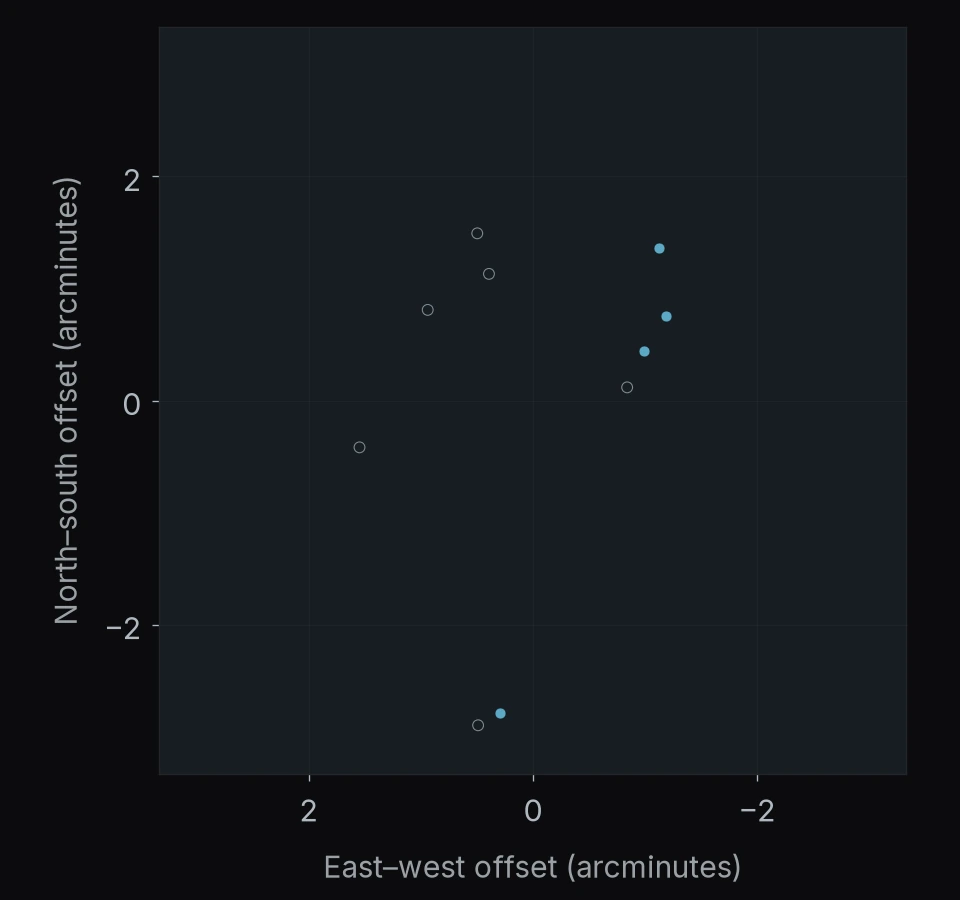
REGION 79 OF 122
MACS J0257.1-2325
10 objects
- Watch list8
- Selected after vetting2
North is up · east is left.
Axes show angular offsets from the region center.
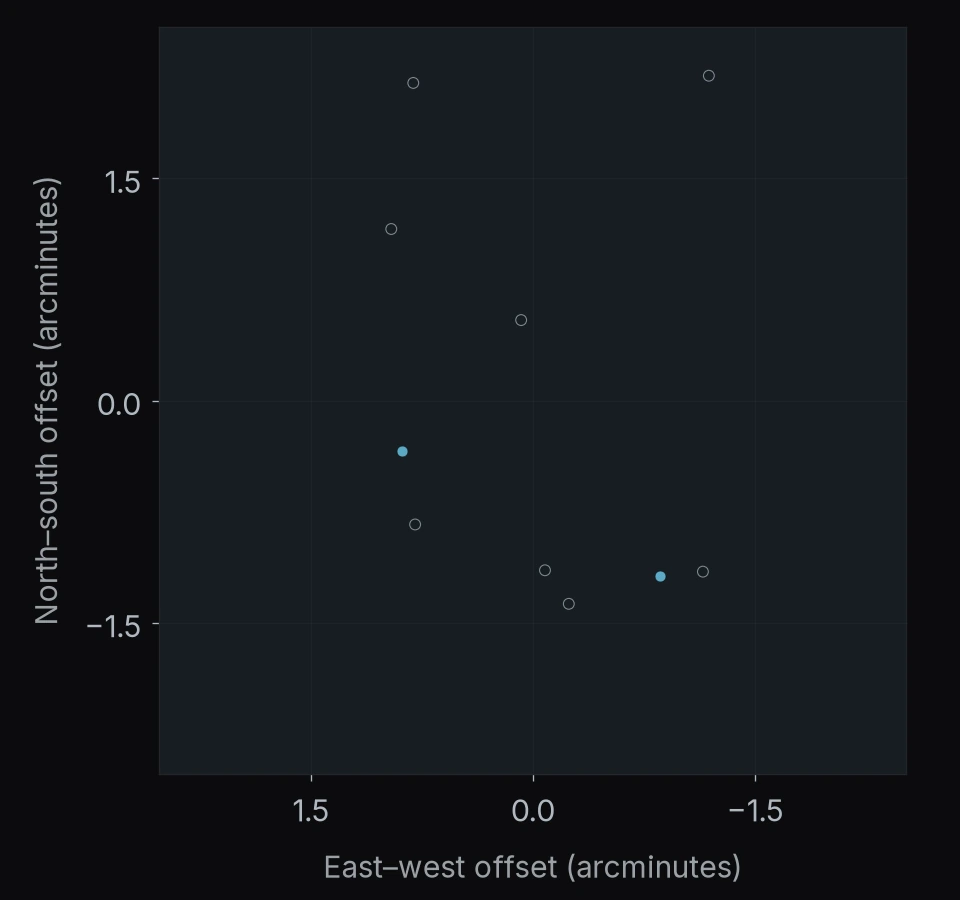
REGION 80 OF 122
PANORAMIC J013748-2152
10 objects
- Watch list5
- Selected after vetting4
- Recovered in published JWST catalogs1
North is up · east is left.
Axes show angular offsets from the region center.
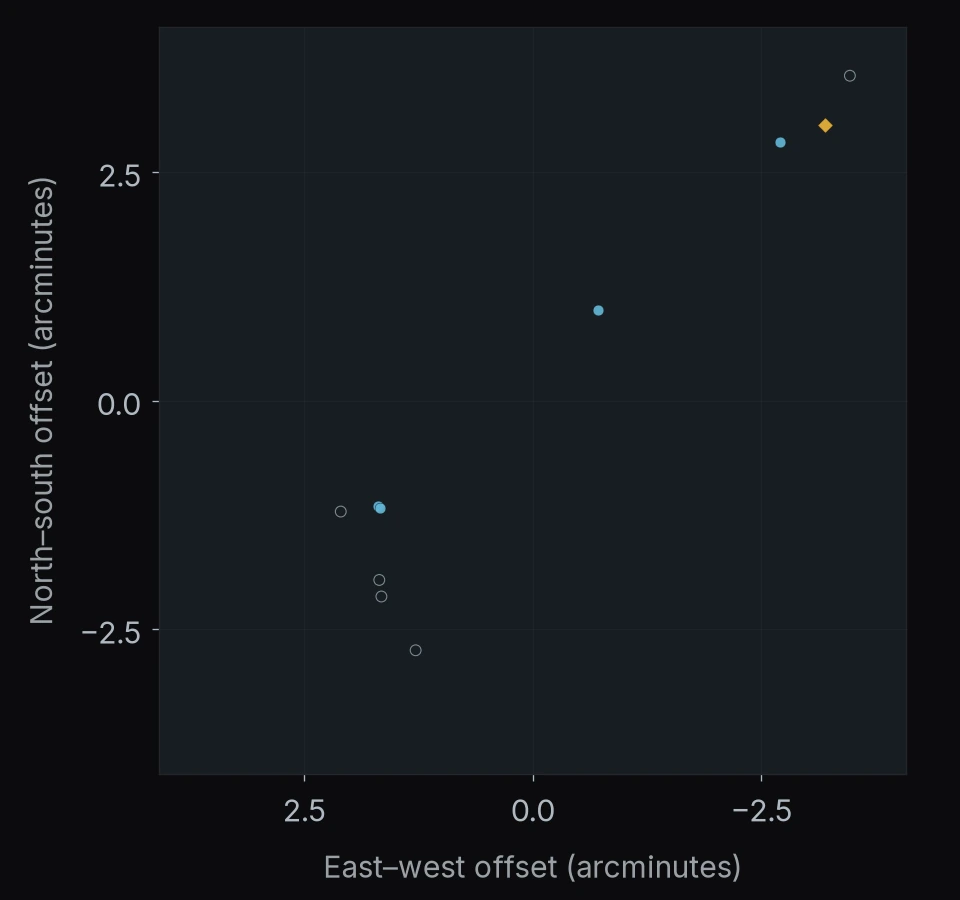
REGION 81 OF 122
MACS J0159.8-0849
10 objects
- Watch list5
- Selected after vetting5
North is up · east is left.
Axes show angular offsets from the region center.
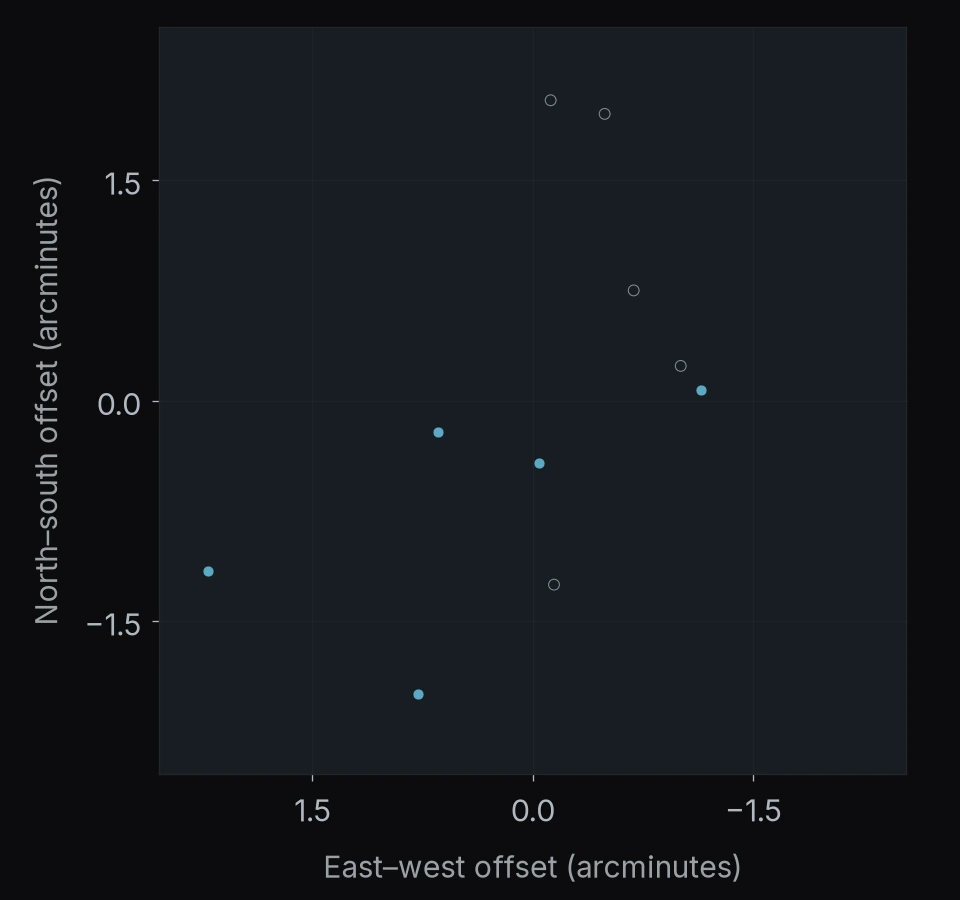
REGION 82 OF 122
PANORAMIC J013444-1532
10 objects
- Watch list6
- Selected after vetting2
- Recovered in published JWST catalogs2
North is up · east is left.
Axes show angular offsets from the region center.
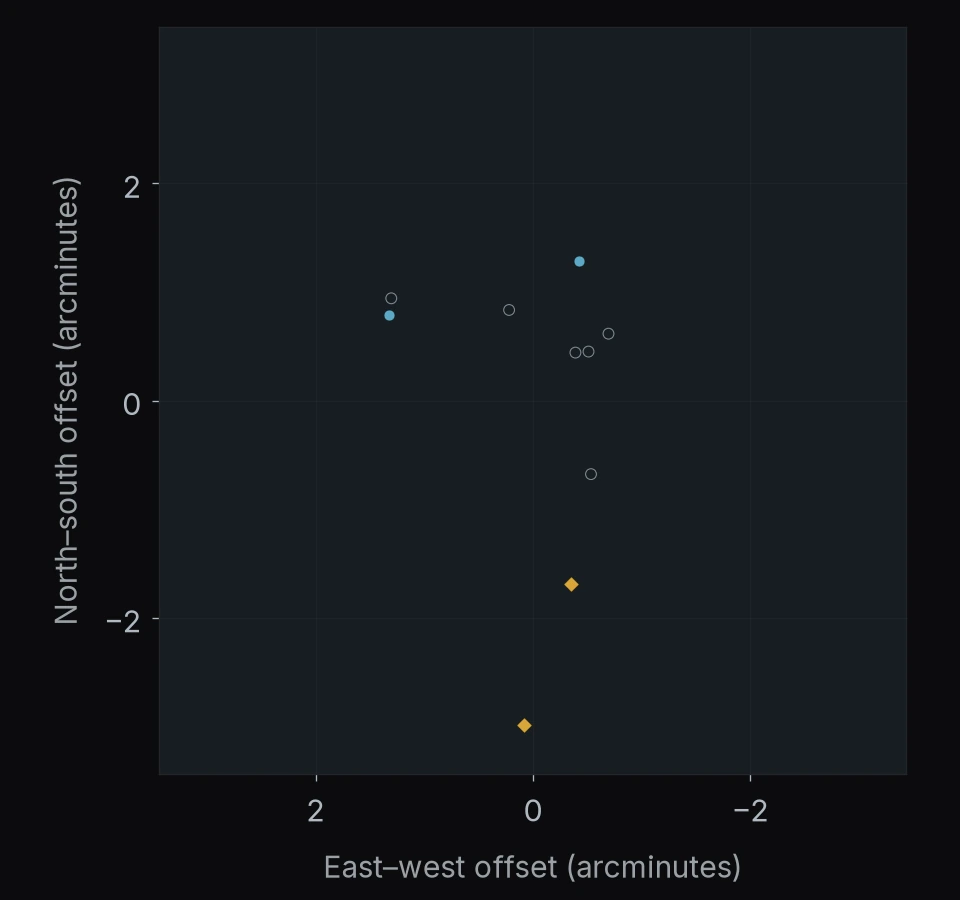
REGION 83 OF 122
RA 260.93° Dec +34.20°
10 objects
- Watch list10
North is up · east is left.
Axes show angular offsets from the region center.
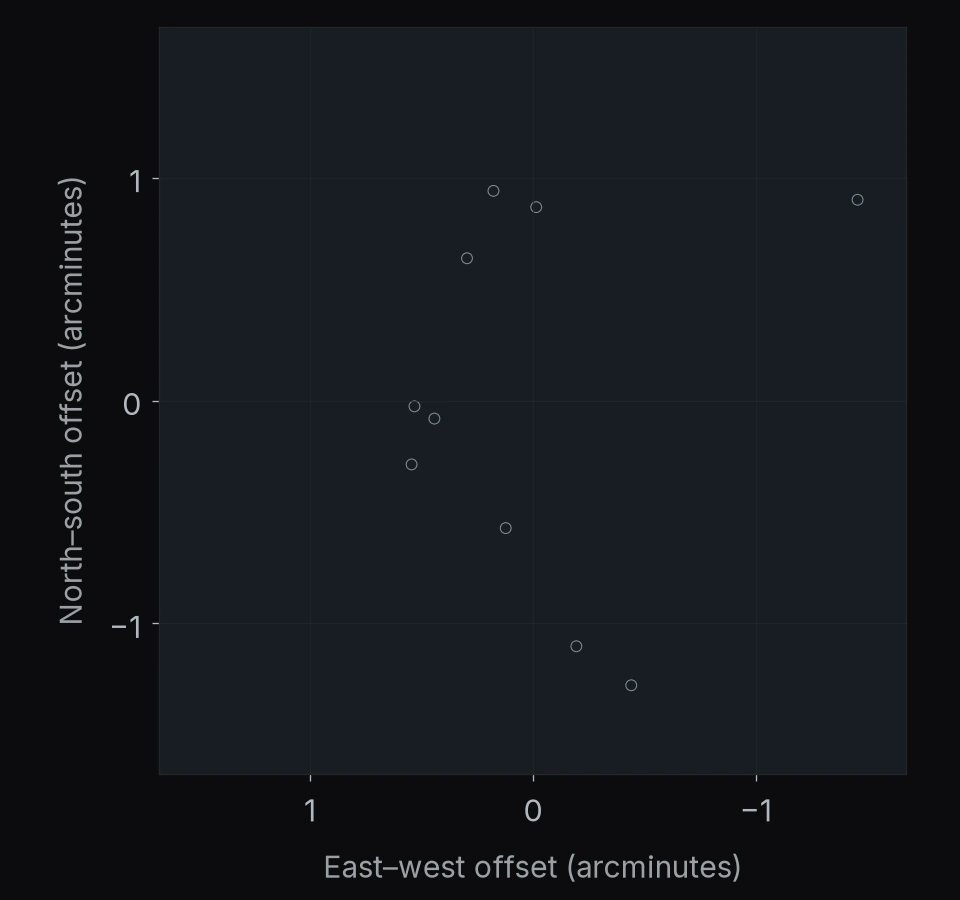
REGION 84 OF 122
PANORAMIC J134348+5549
10 objects
- Watch list6
- Selected after vetting4
North is up · east is left.
Axes show angular offsets from the region center.
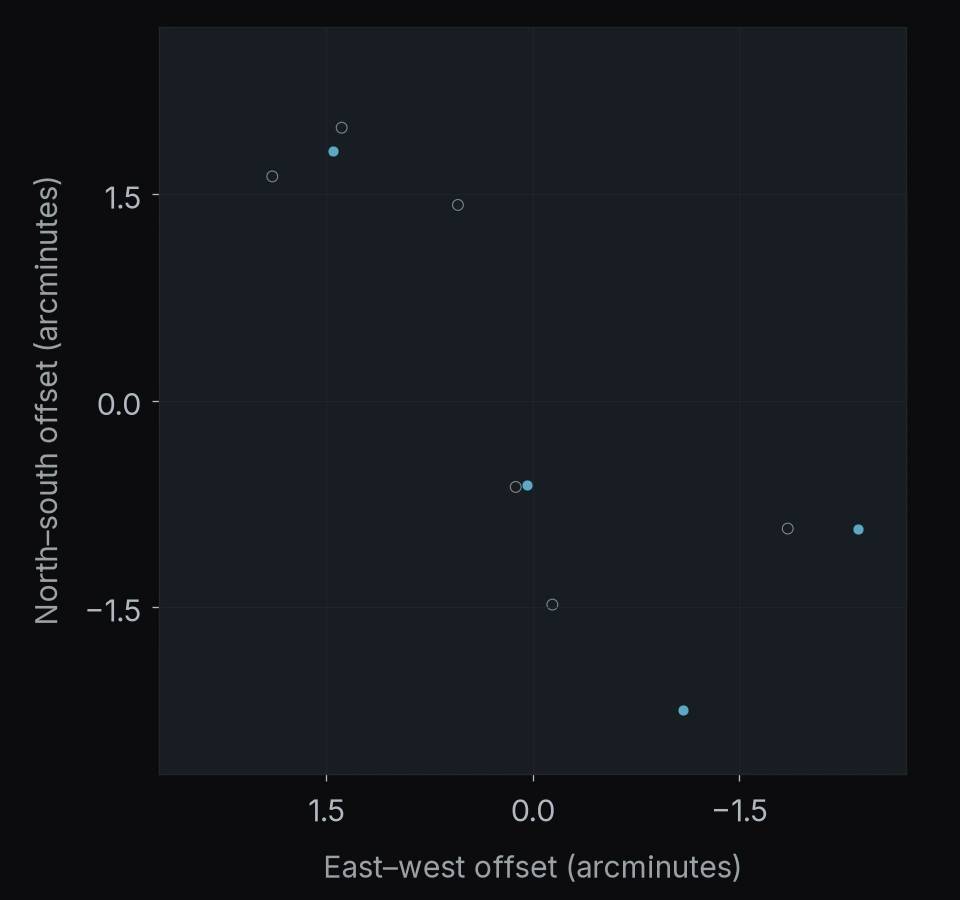
REGION 85 OF 122
PANORAMIC J144904-1017
10 objects
- Watch list5
- Selected after vetting4
- Recovered in published JWST catalogs1
North is up · east is left.
Axes show angular offsets from the region center.
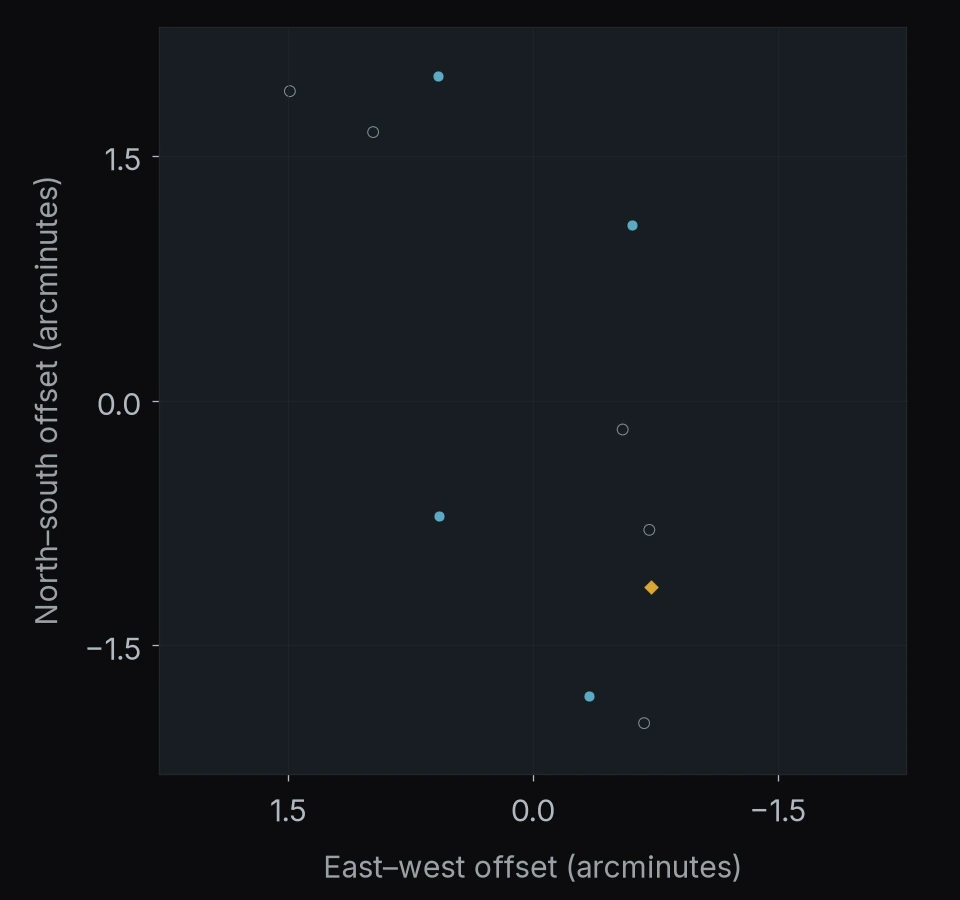
REGION 86 OF 122
SGAS J1429+1202
10 objects
- Watch list9
- Selected after vetting1
North is up · east is left.
Axes show angular offsets from the region center.
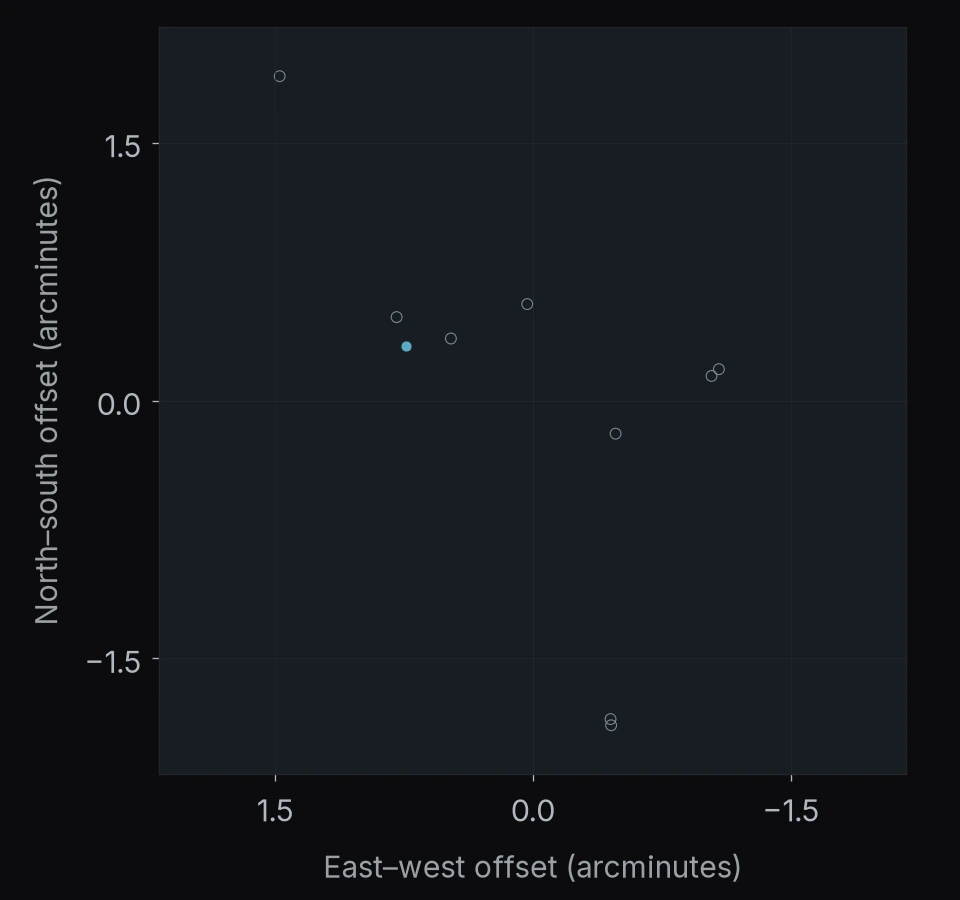
REGION 87 OF 122
POPPIES pointing 120
10 objects
- Watch list8
- Selected after vetting2
North is up · east is left.
Axes show angular offsets from the region center.
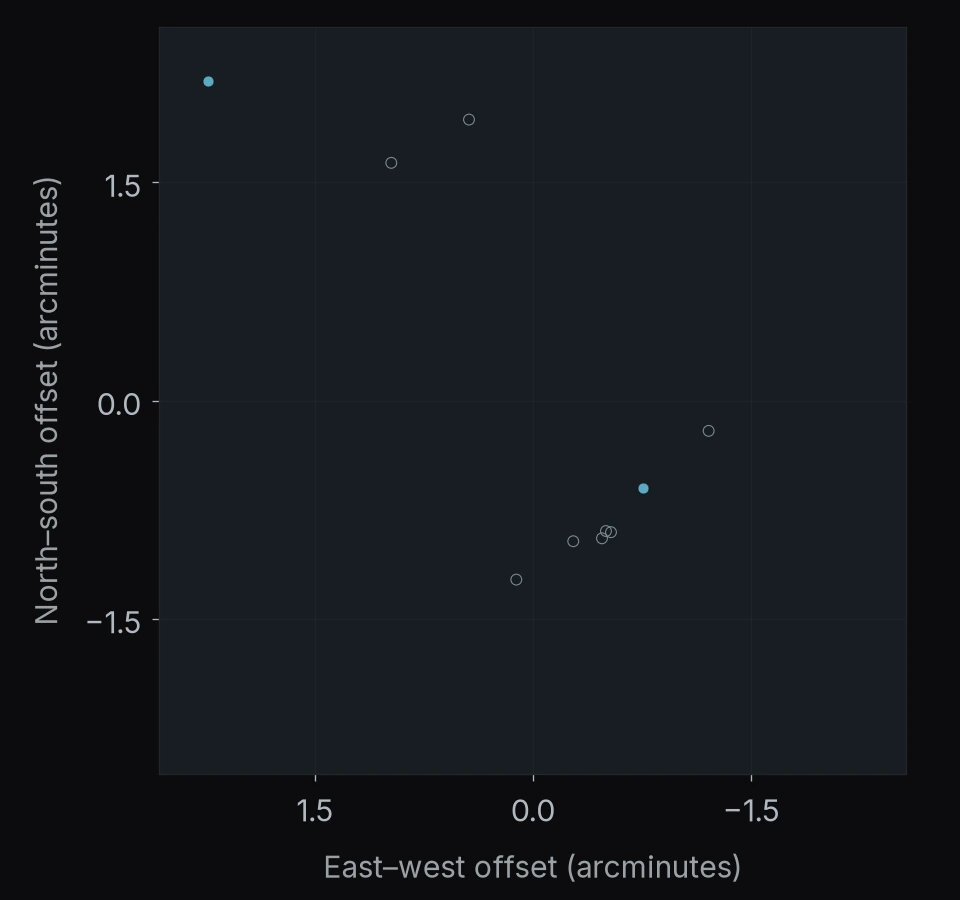
REGION 88 OF 122
MACS J1311.0-0310
10 objects
- Watch list5
- Selected after vetting5
North is up · east is left.
Axes show angular offsets from the region center.
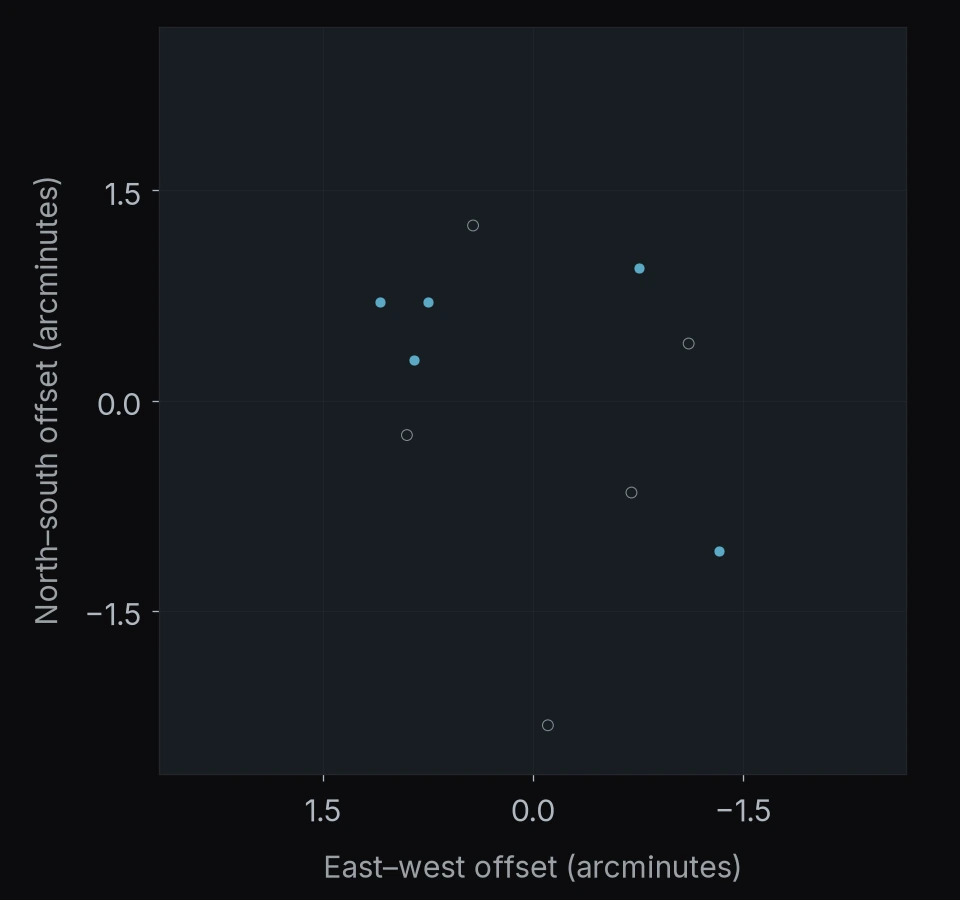
REGION 89 OF 122
RA 83.99° Dec -69.18°
9 objects
- Watch list9
North is up · east is left.
Axes show angular offsets from the region center.
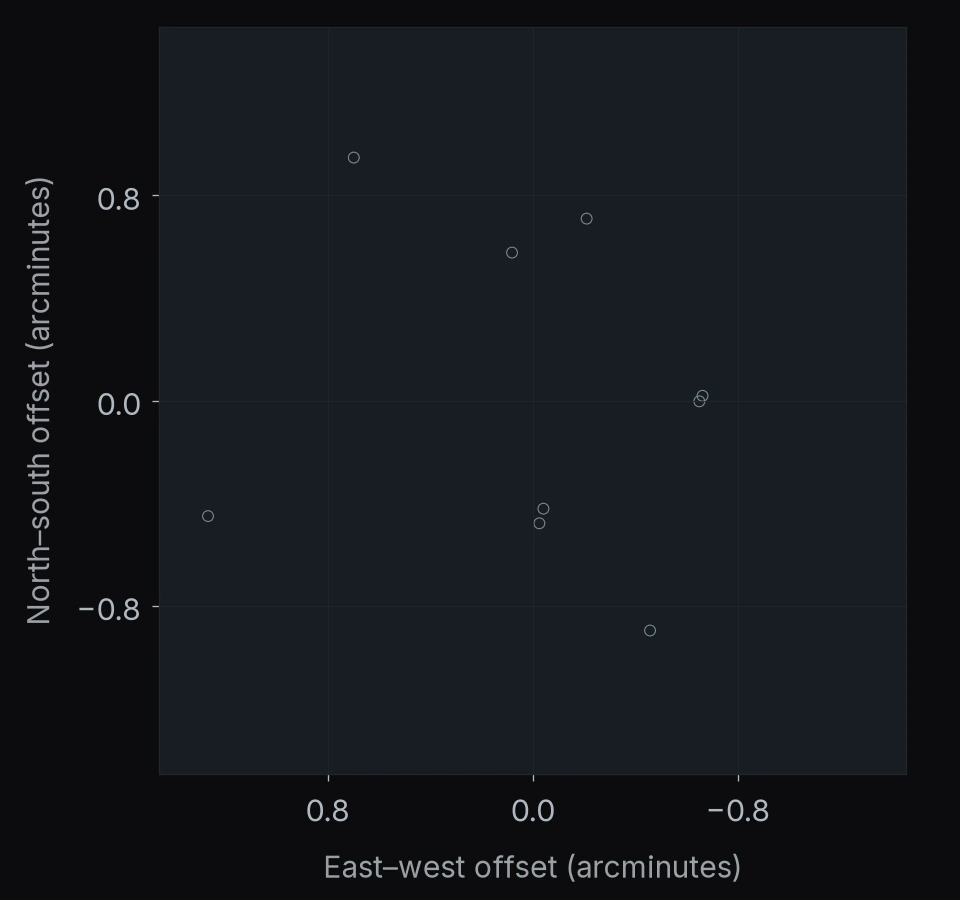
REGION 90 OF 122
MACS J2129.4-0741
9 objects
- Watch list8
- Selected after vetting1
North is up · east is left.
Axes show angular offsets from the region center.
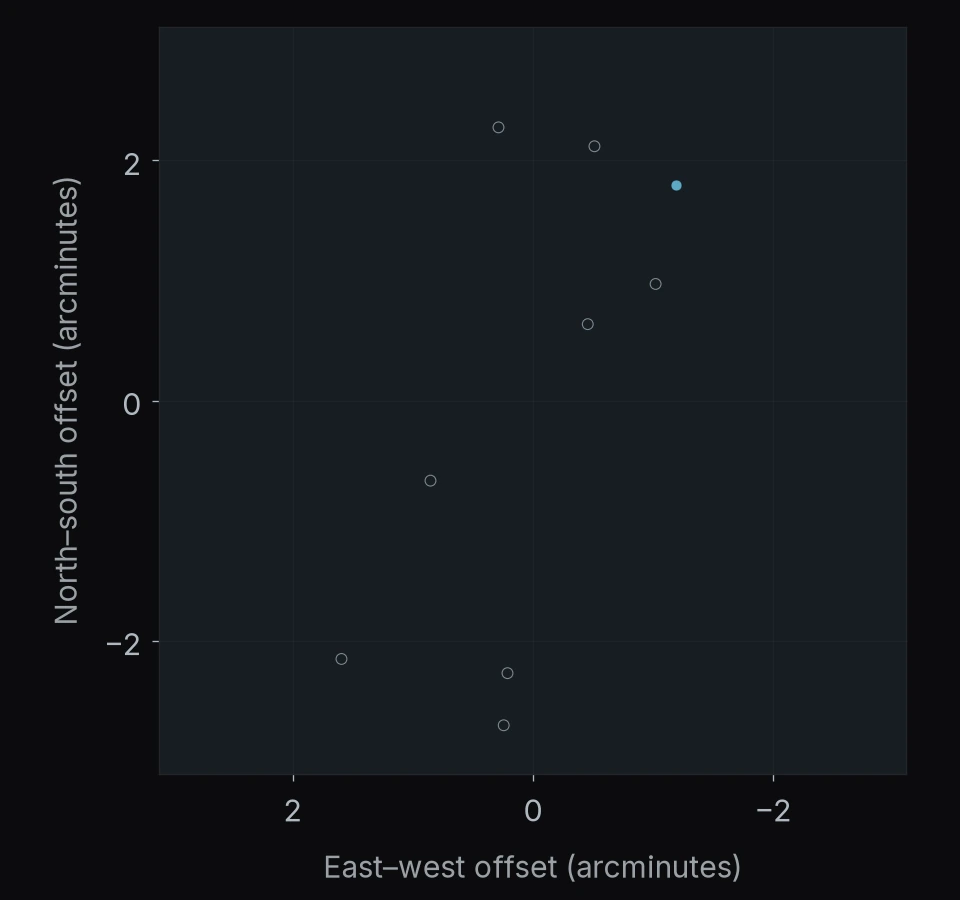
REGION 91 OF 122
SDSS J2054-0005
9 objects
- Watch list1
- Selected after vetting8
North is up · east is left.
Axes show angular offsets from the region center.
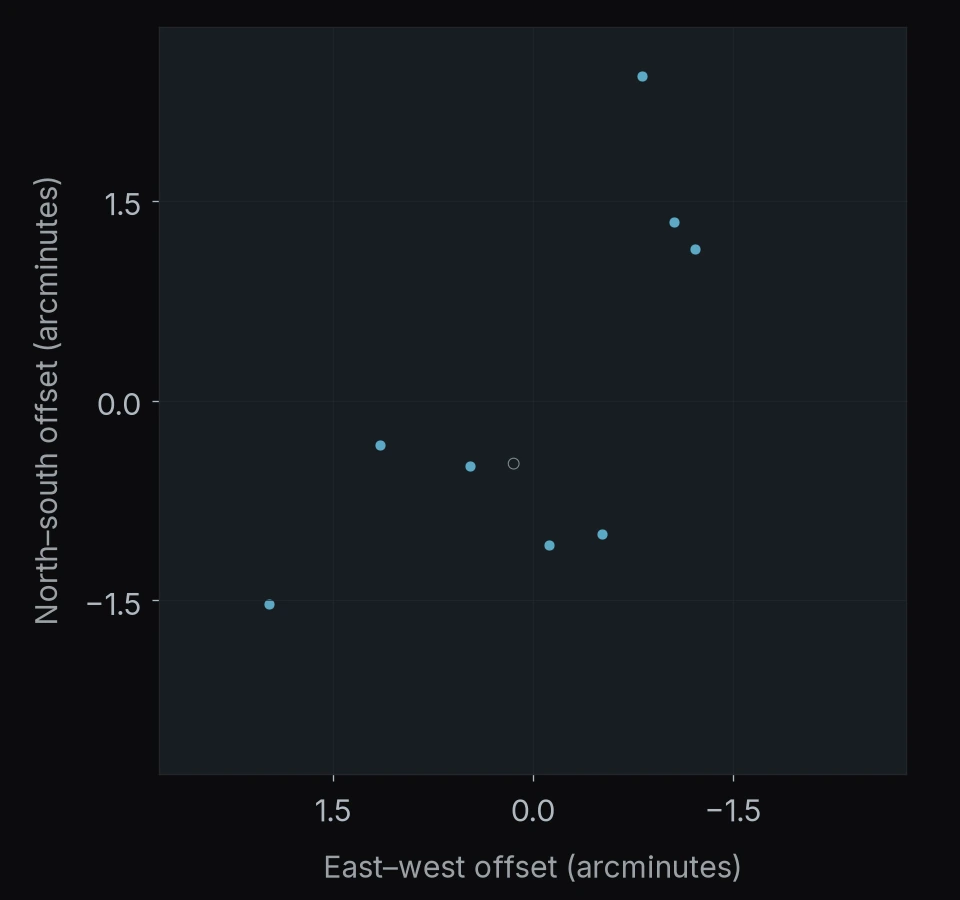
REGION 92 OF 122
PANORAMIC J010408-5508
9 objects
- Watch list5
- BH* selection below redshift 31
- Recovered in published JWST catalogs3
North is up · east is left.
Axes show angular offsets from the region center.
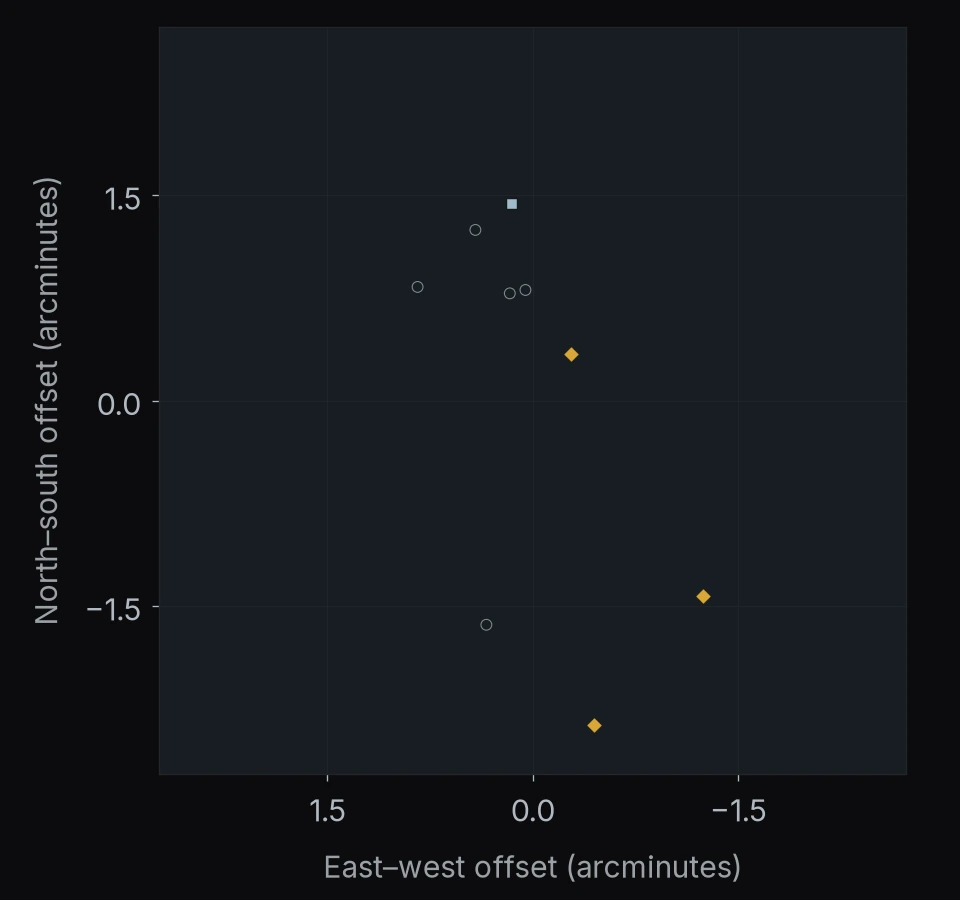
REGION 93 OF 122
MACS J0035.4-2015
9 objects
- Watch list6
- Selected after vetting3
North is up · east is left.
Axes show angular offsets from the region center.
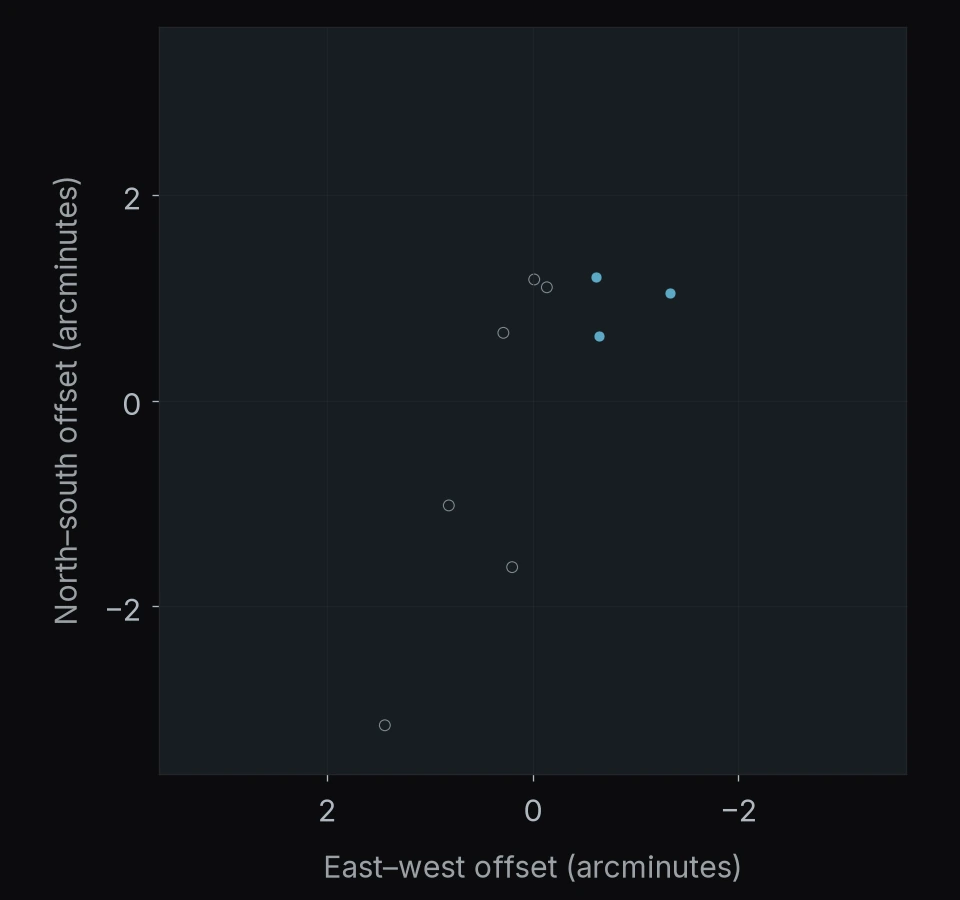
REGION 94 OF 122
MACS J1115.9+0129
9 objects
- Watch list8
- Selected after vetting1
North is up · east is left.
Axes show angular offsets from the region center.
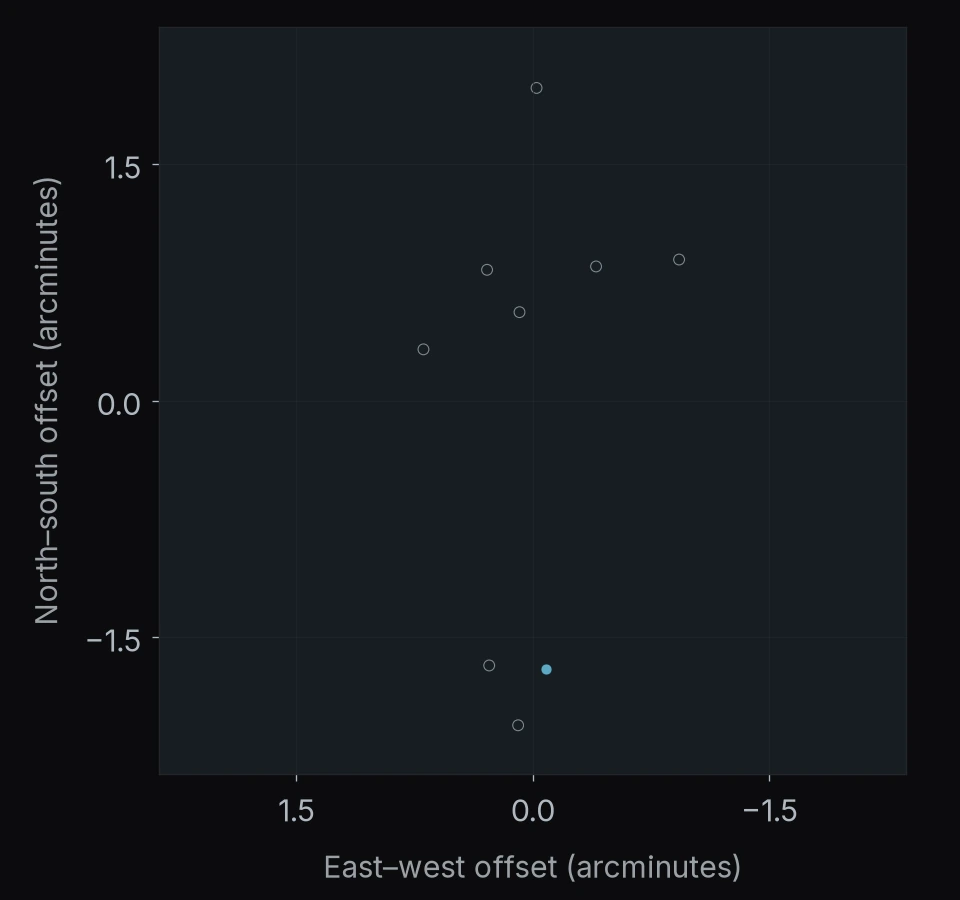
REGION 95 OF 122
PANORAMIC J121932+0330
9 objects
- Watch list8
- Selected after vetting1
North is up · east is left.
Axes show angular offsets from the region center.
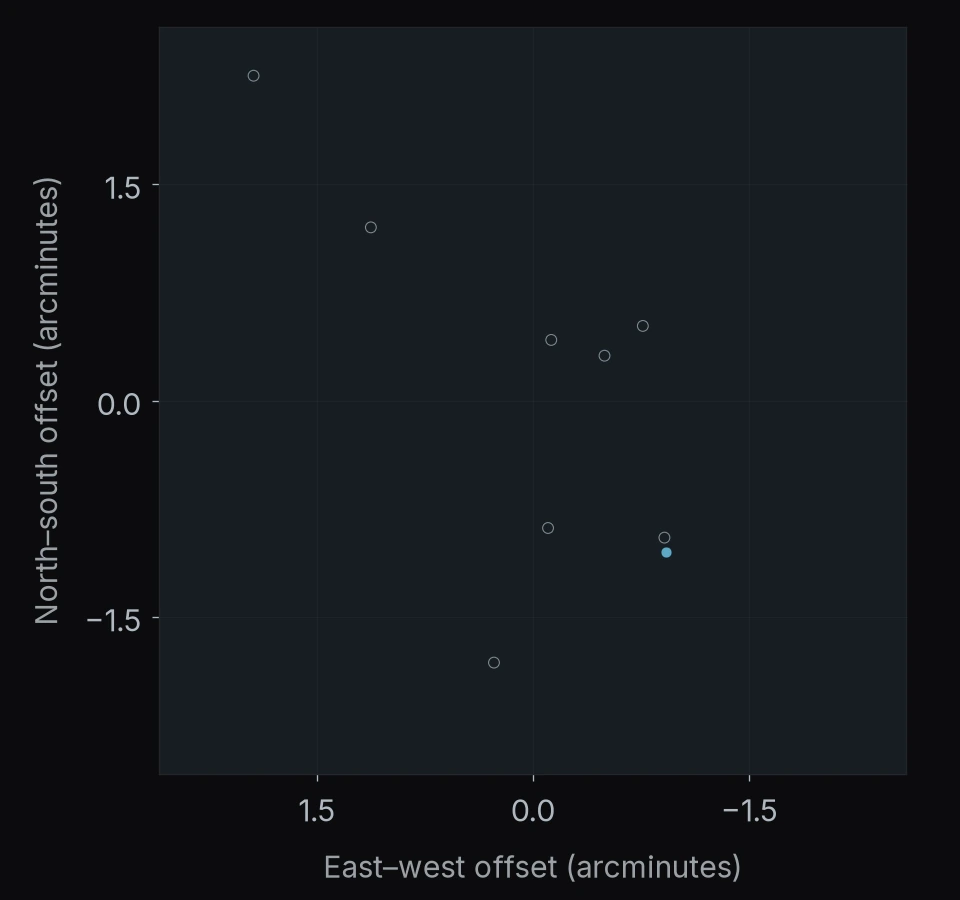
REGION 96 OF 122
MACS J0647.8+7015
8 objects
- Watch list2
- Selected after vetting6
North is up · east is left.
Axes show angular offsets from the region center.
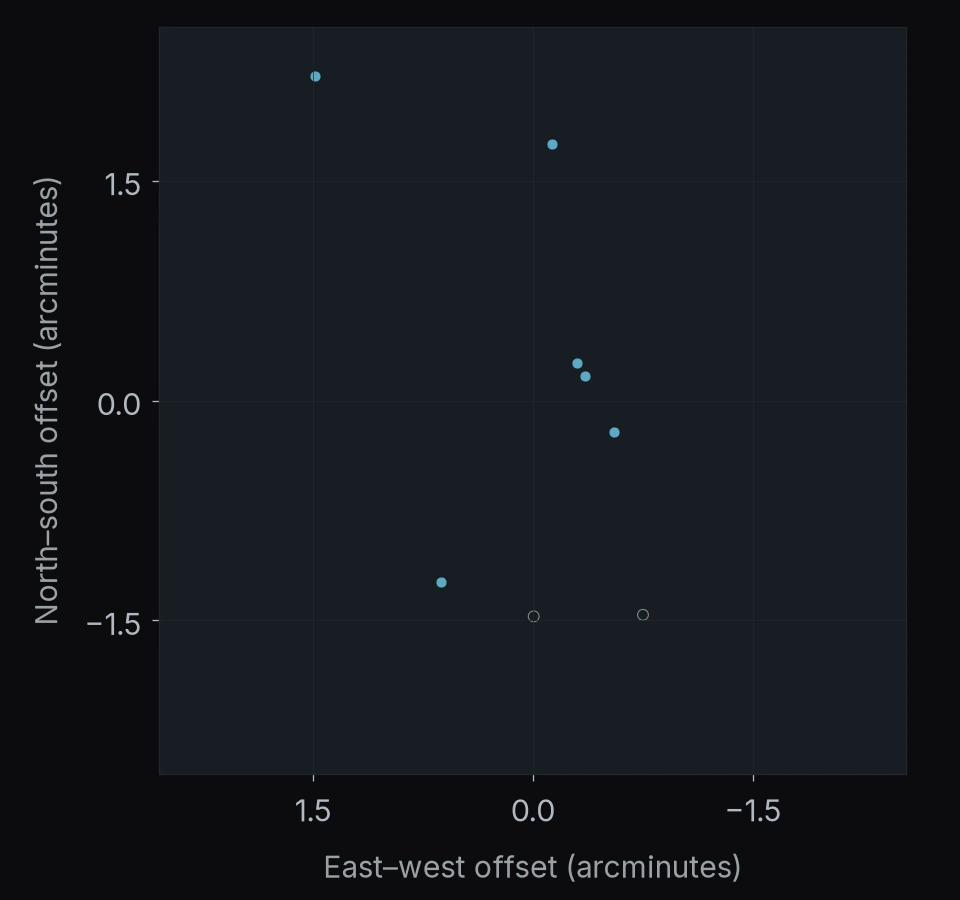
REGION 97 OF 122
MACS J0717.5+3745
8 objects
- Watch list5
- Selected after vetting3
North is up · east is left.
Axes show angular offsets from the region center.
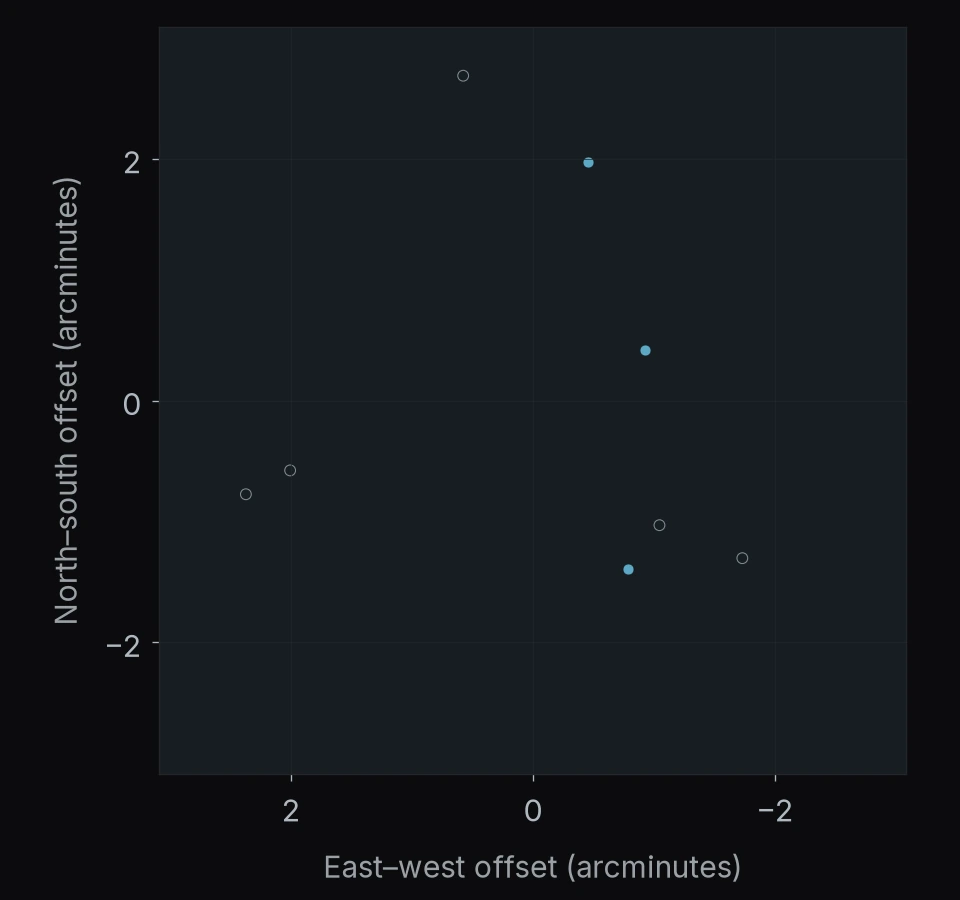
REGION 98 OF 122
PANORAMIC J170720+5853
8 objects
- Watch list5
- Selected after vetting1
- Recovered in published JWST catalogs2
North is up · east is left.
Axes show angular offsets from the region center.
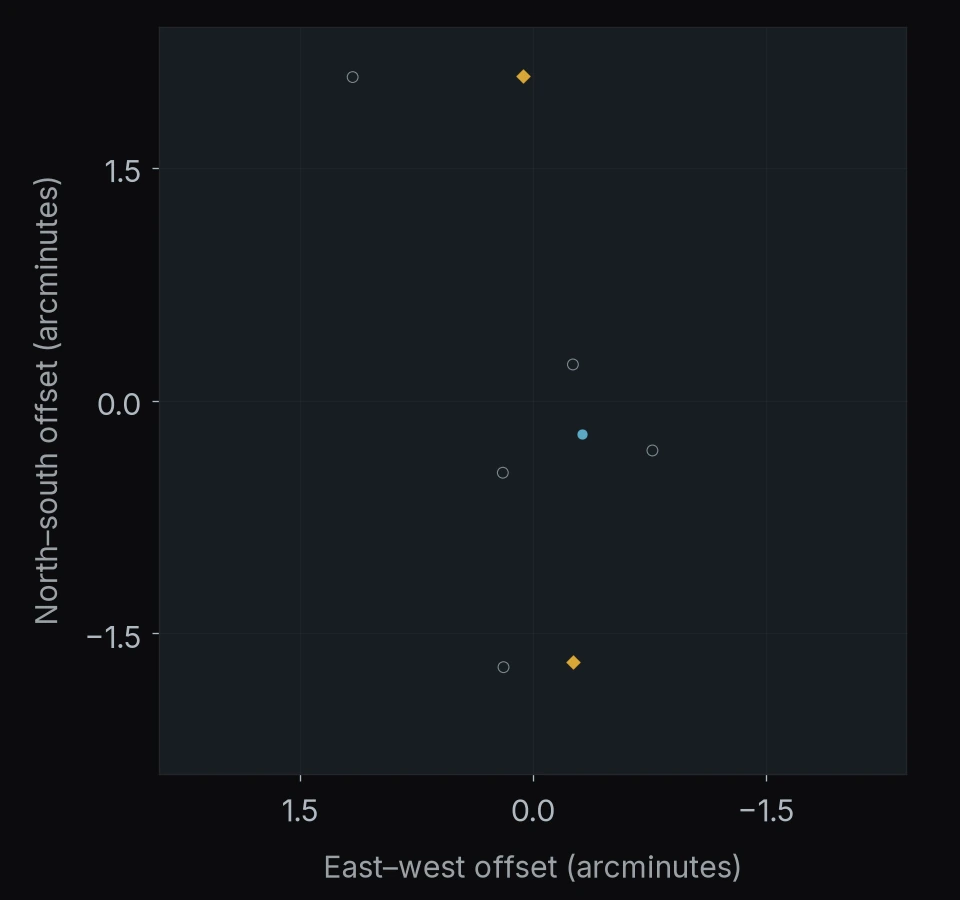
REGION 99 OF 122
Abell 1689
8 objects
- Watch list7
- Selected after vetting1
North is up · east is left.
Axes show angular offsets from the region center.
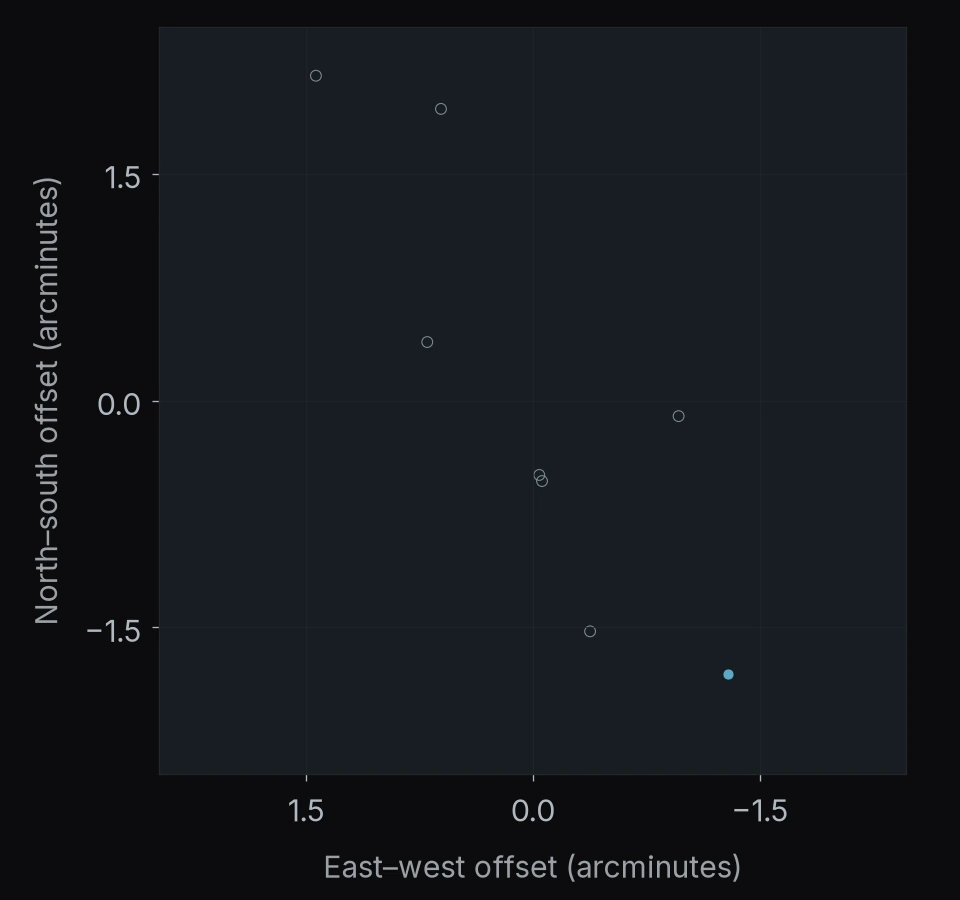
REGION 100 OF 122
RA 200.94° Dec +27.56°
8 objects
- Watch list8
North is up · east is left.
Axes show angular offsets from the region center.
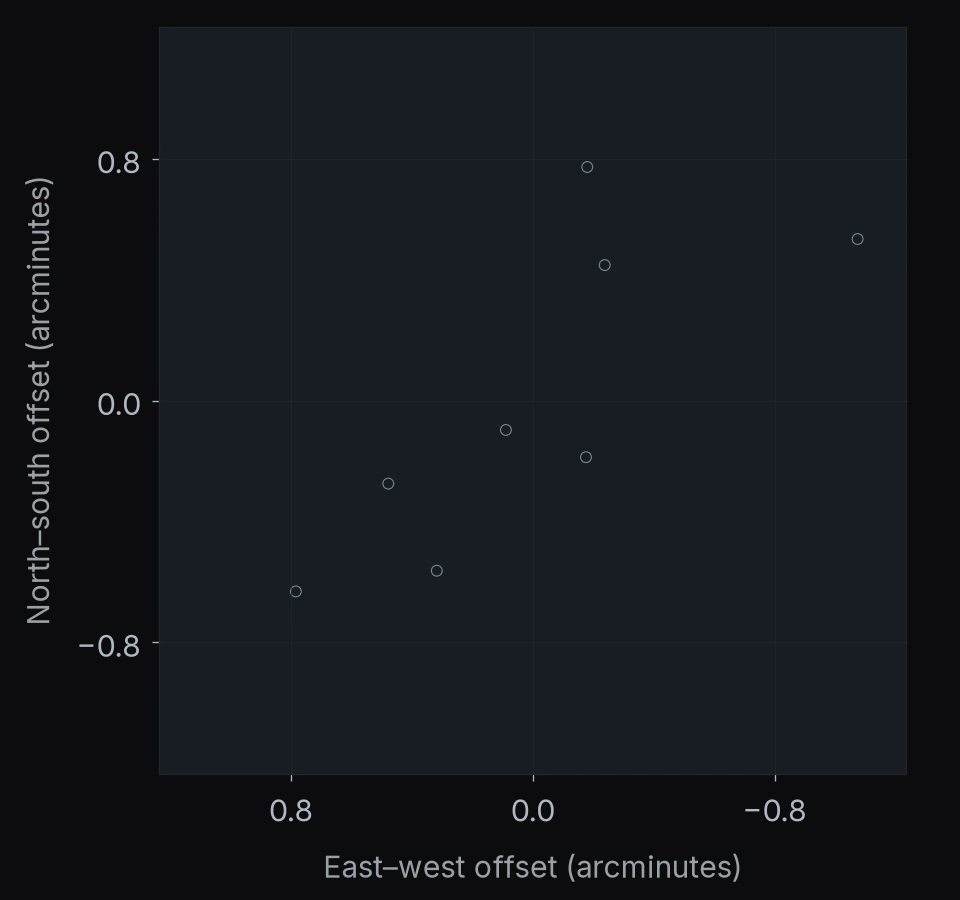
REGION 101 OF 122
MACS J0553.4-3342
7 objects
- Watch list3
- Selected after vetting4
North is up · east is left.
Axes show angular offsets from the region center.
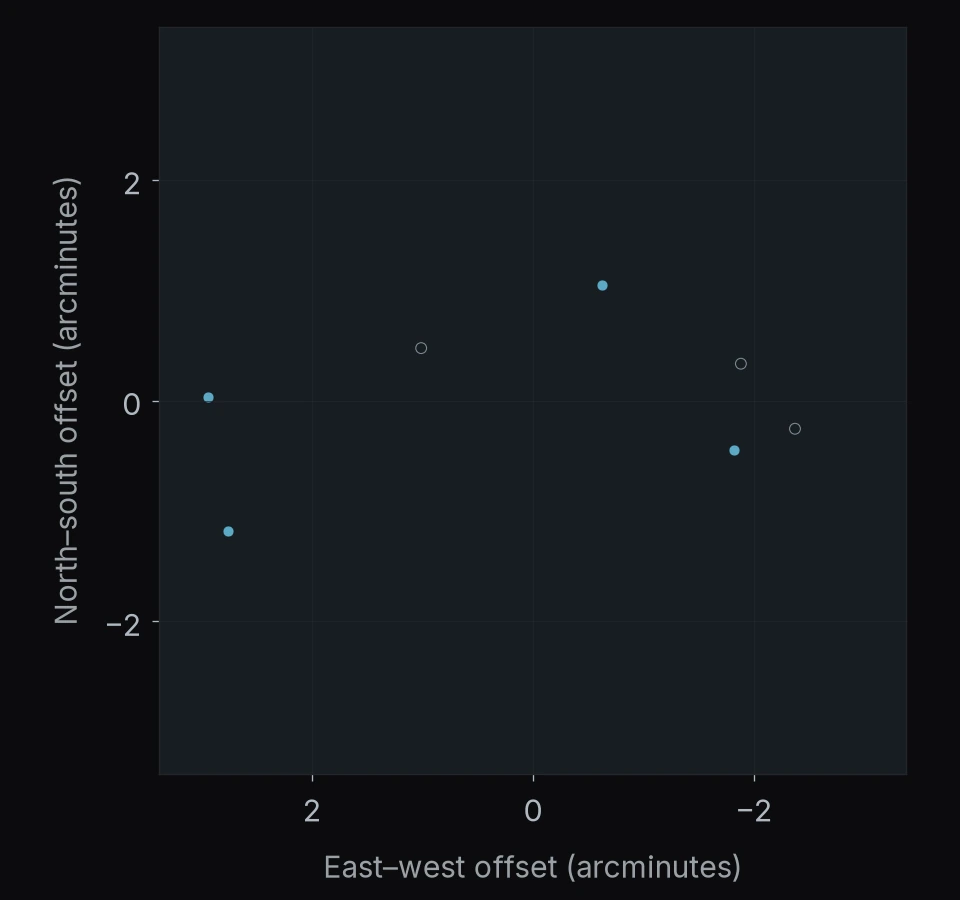
REGION 102 OF 122
Abell 521
7 objects
- Watch list3
- Selected after vetting4
North is up · east is left.
Axes show angular offsets from the region center.
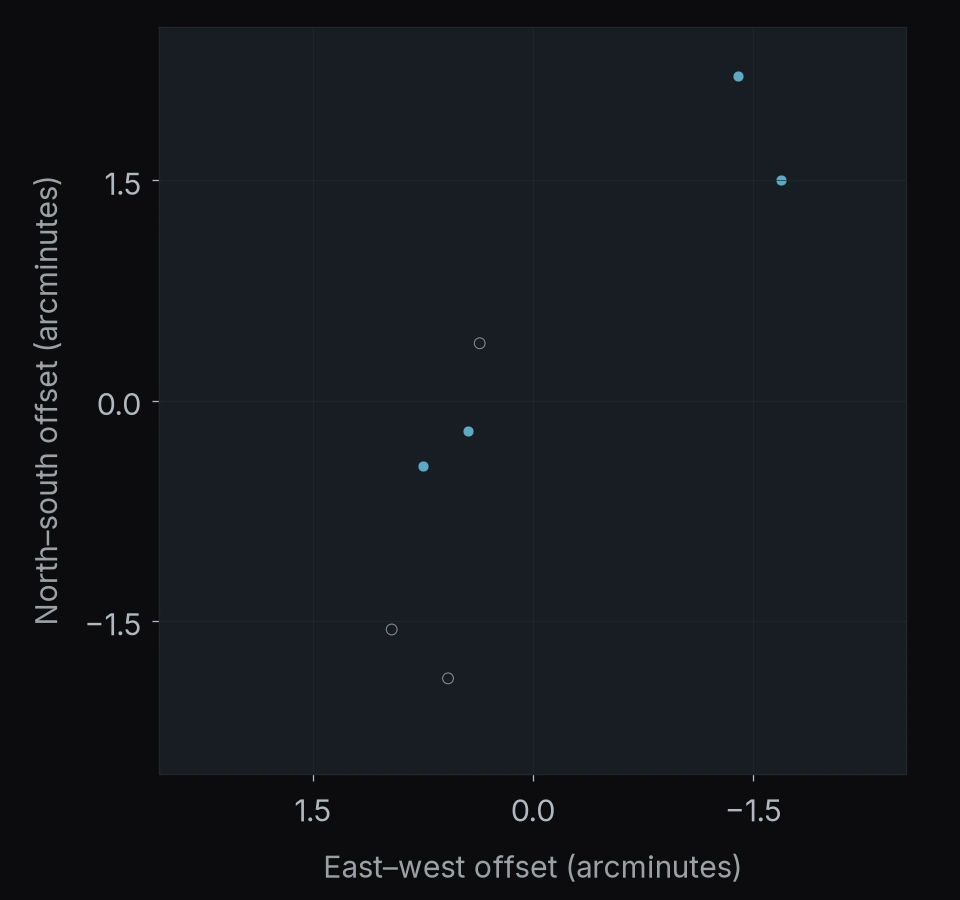
REGION 103 OF 122
MACS J0429.6-0253
7 objects
- Watch list5
- Selected after vetting2
North is up · east is left.
Axes show angular offsets from the region center.
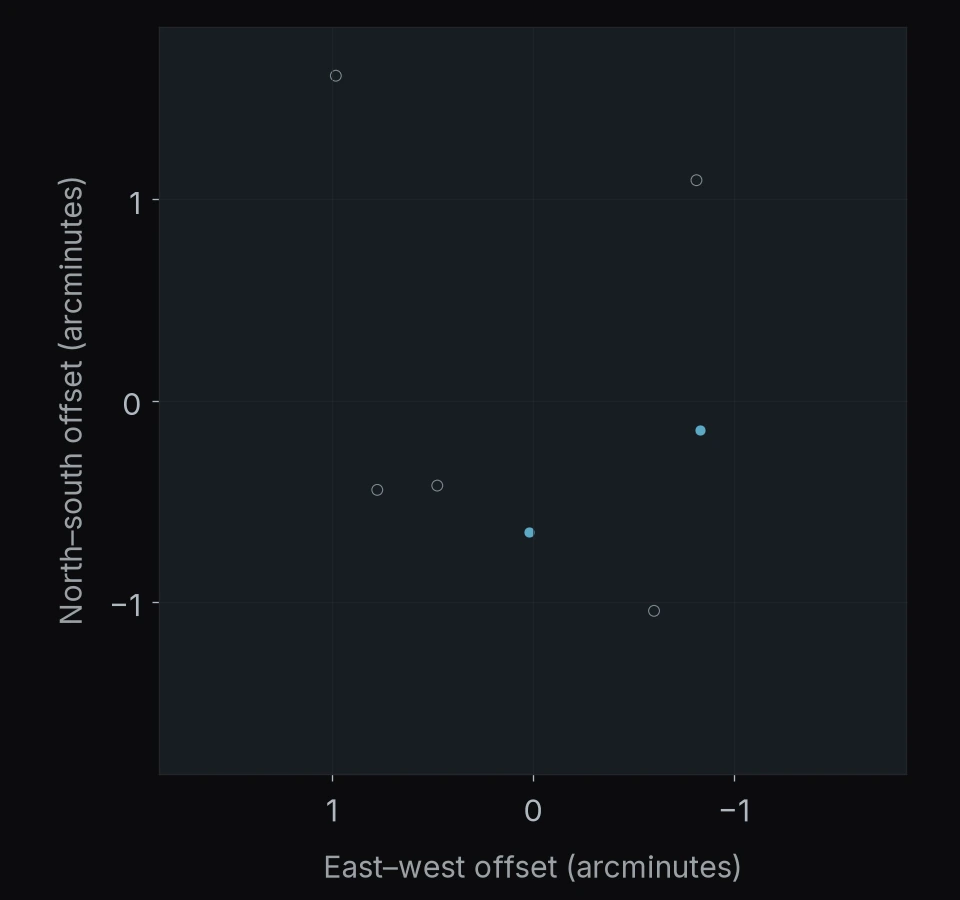
REGION 104 OF 122
PANORAMIC J123140-1618
7 objects
- Watch list2
- Selected after vetting4
- Recovered in published JWST catalogs1
North is up · east is left.
Axes show angular offsets from the region center.
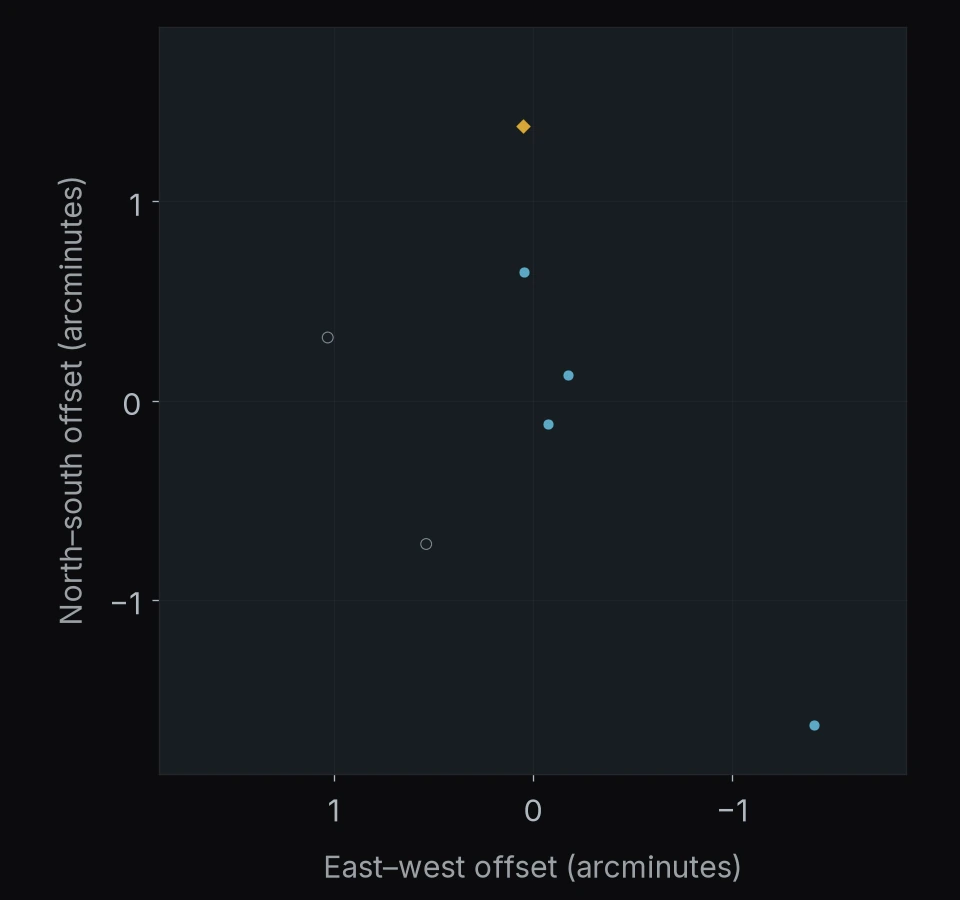
REGION 105 OF 122
SGAS J1226+2152
7 objects
- Watch list4
- Selected after vetting3
North is up · east is left.
Axes show angular offsets from the region center.
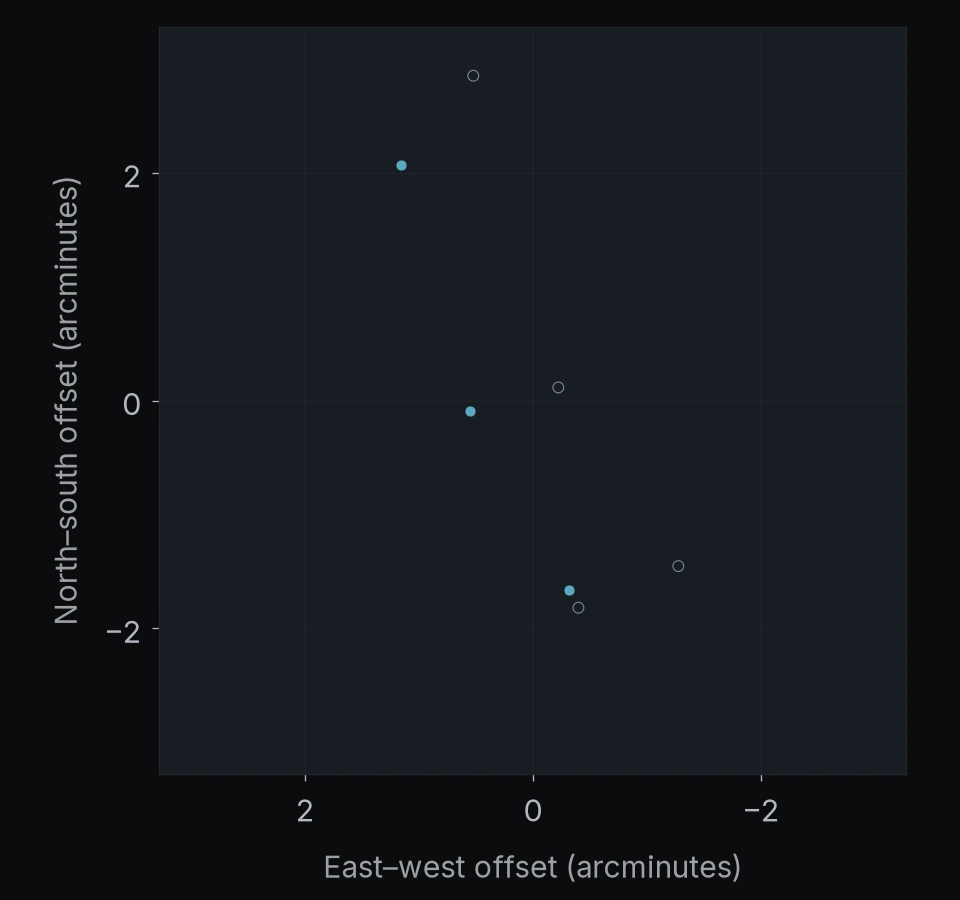
REGION 106 OF 122
Cosmic Eye
6 objects
- Watch list4
- Selected after vetting2
North is up · east is left.
Axes show angular offsets from the region center.
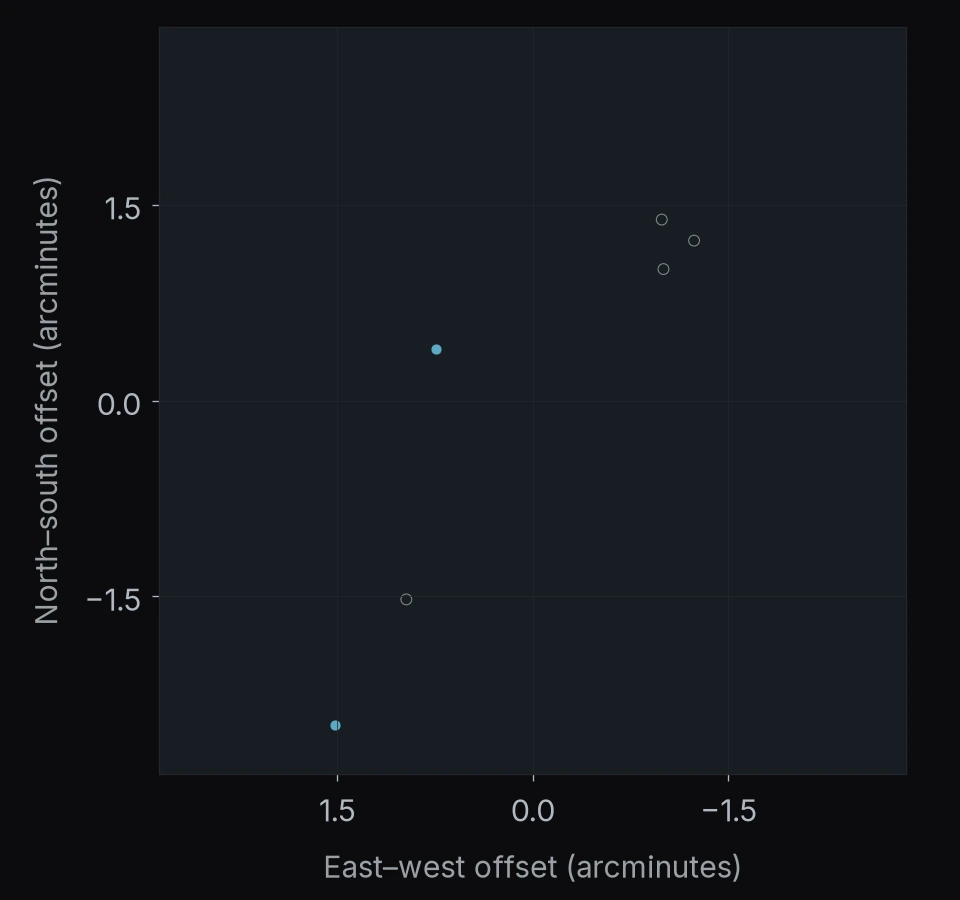
REGION 107 OF 122
PANORAMIC J234512-4235
6 objects
- Watch list3
- Selected after vetting3
North is up · east is left.
Axes show angular offsets from the region center.
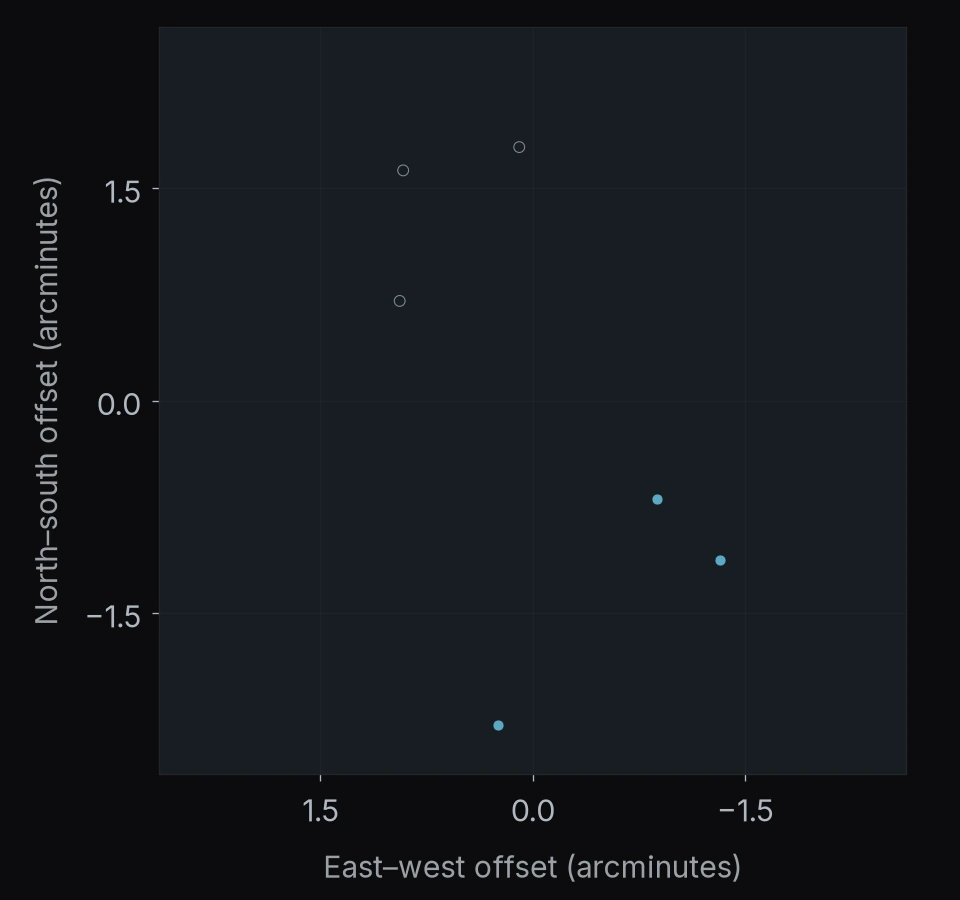
REGION 108 OF 122
SMACS J2131.1-4019
6 objects
- Watch list2
- Selected after vetting4
North is up · east is left.
Axes show angular offsets from the region center.
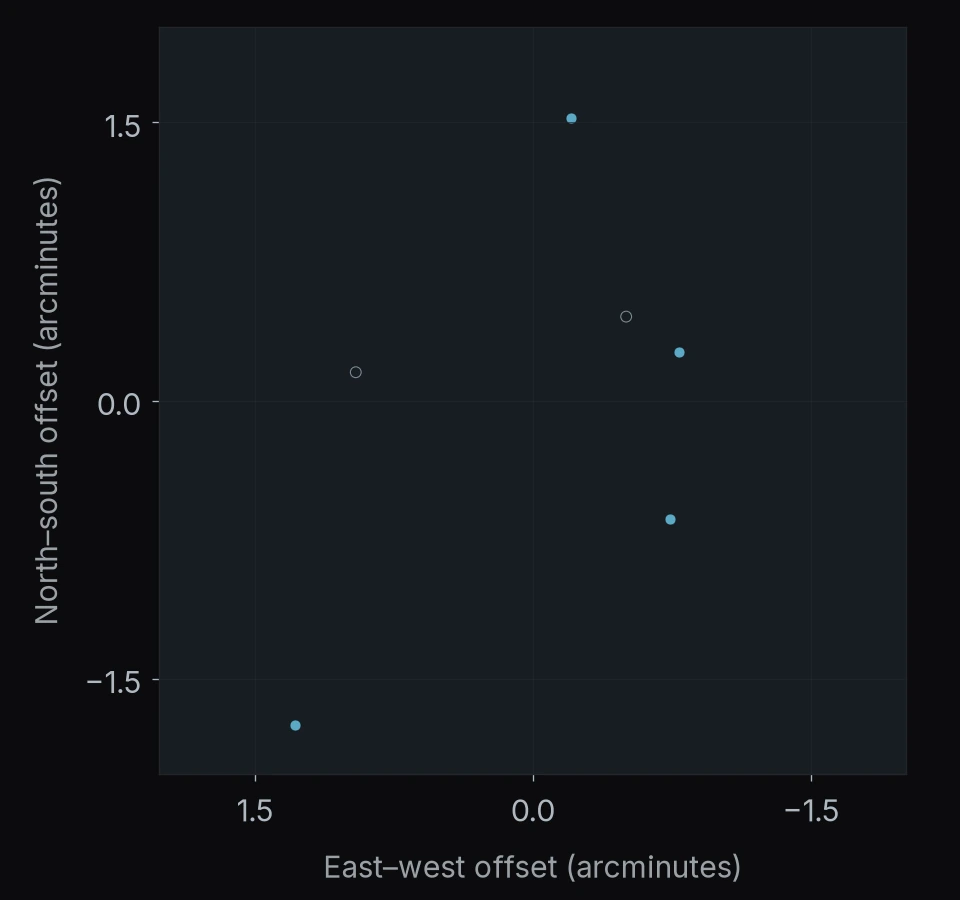
REGION 109 OF 122
POPPIES pointing 121
6 objects
- Watch list3
- Selected after vetting3
North is up · east is left.
Axes show angular offsets from the region center.
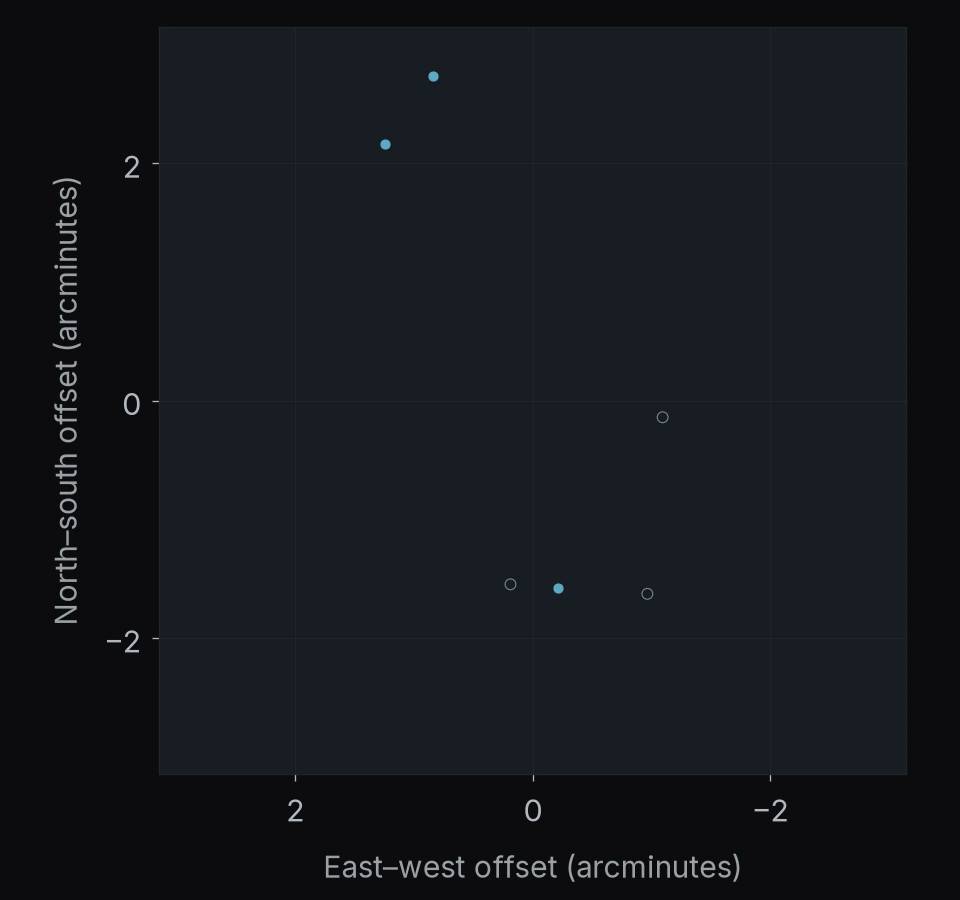
REGION 110 OF 122
MS 2137.3-2353
5 objects
- Watch list4
- Selected after vetting1
North is up · east is left.
Axes show angular offsets from the region center.
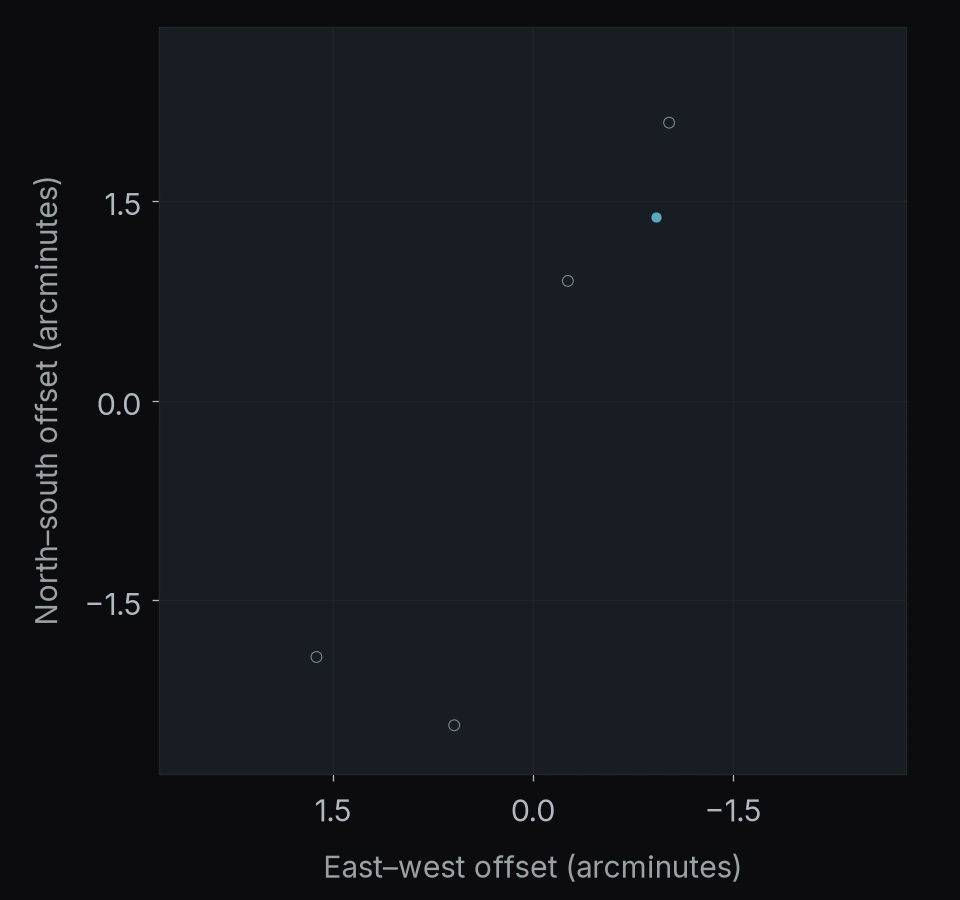
REGION 111 OF 122
SGAS J2111-0114
5 objects
- Watch list3
- Selected after vetting2
North is up · east is left.
Axes show angular offsets from the region center.
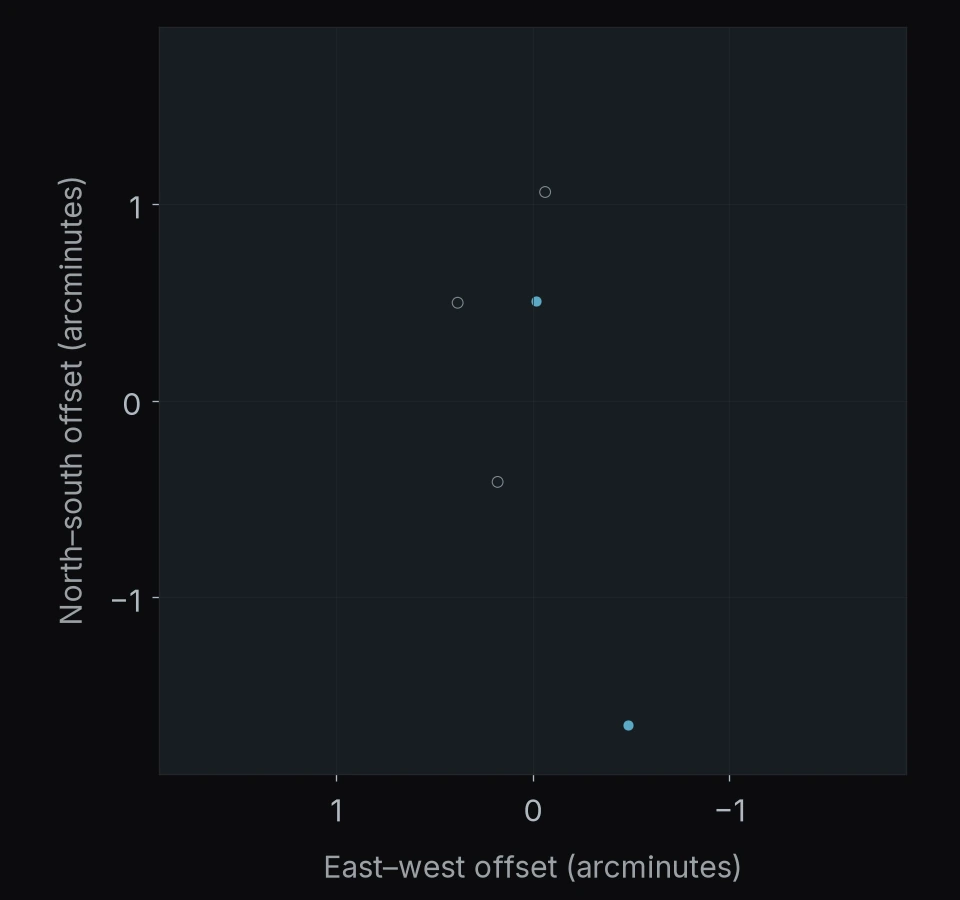
REGION 112 OF 122
RX J2129.7+0005
4 objects
- Watch list1
- Selected after vetting3
North is up · east is left.
Axes show angular offsets from the region center.
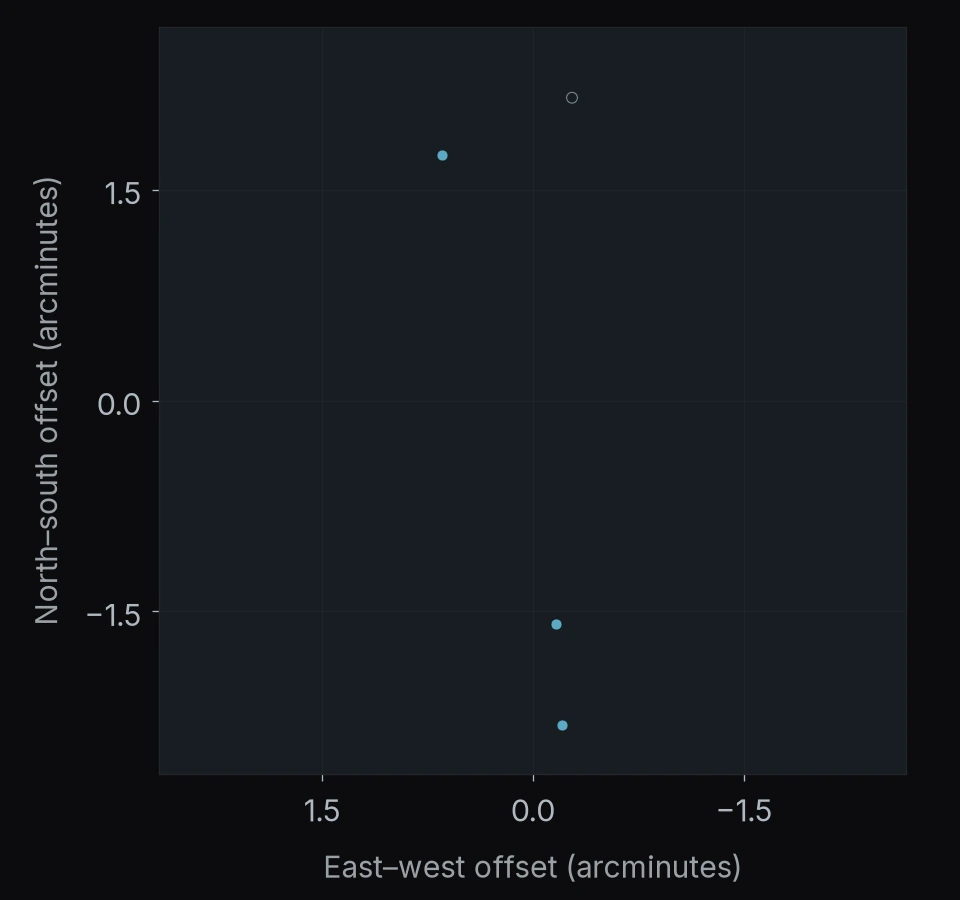
REGION 113 OF 122
RX J1532.9+3021
4 objects
- Watch list2
- Selected after vetting2
North is up · east is left.
Axes show angular offsets from the region center.
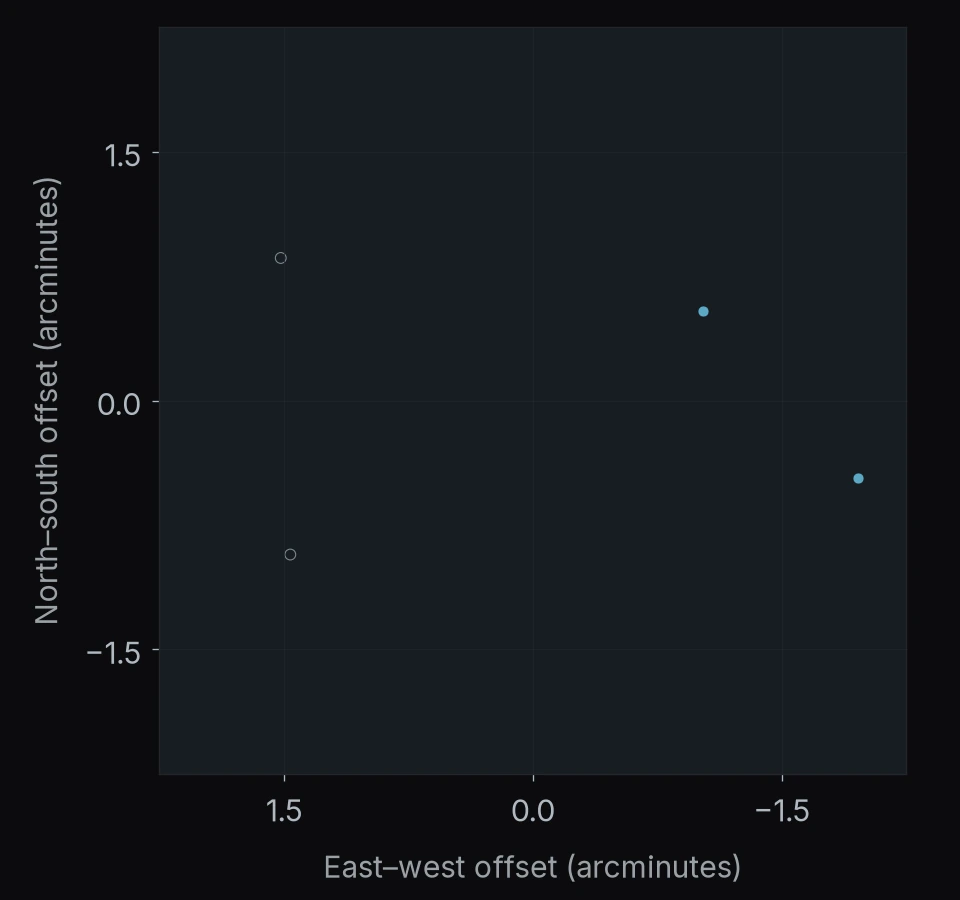
REGION 114 OF 122
MACS J0451.9+0006
3 objects
- Watch list1
- Selected after vetting2
North is up · east is left.
Axes show angular offsets from the region center.
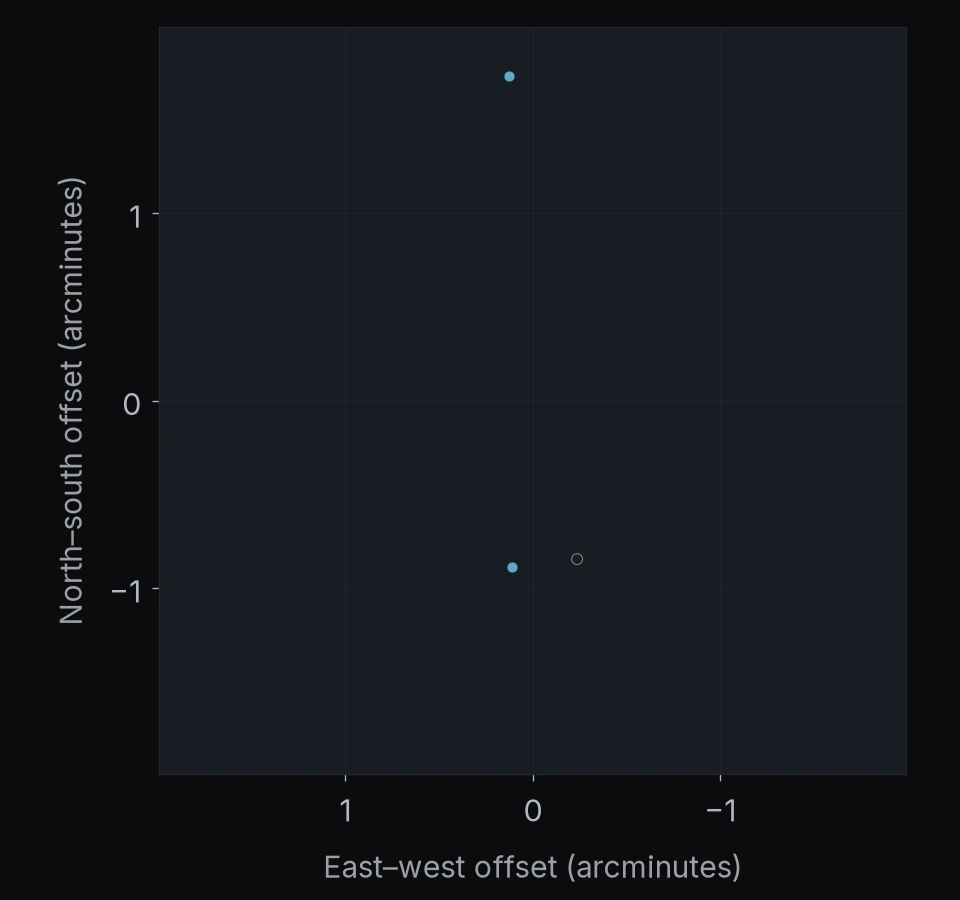
REGION 115 OF 122
SMACS J2031.8-4036
3 objects
- Watch list1
- Selected after vetting2
North is up · east is left.
Axes show angular offsets from the region center.
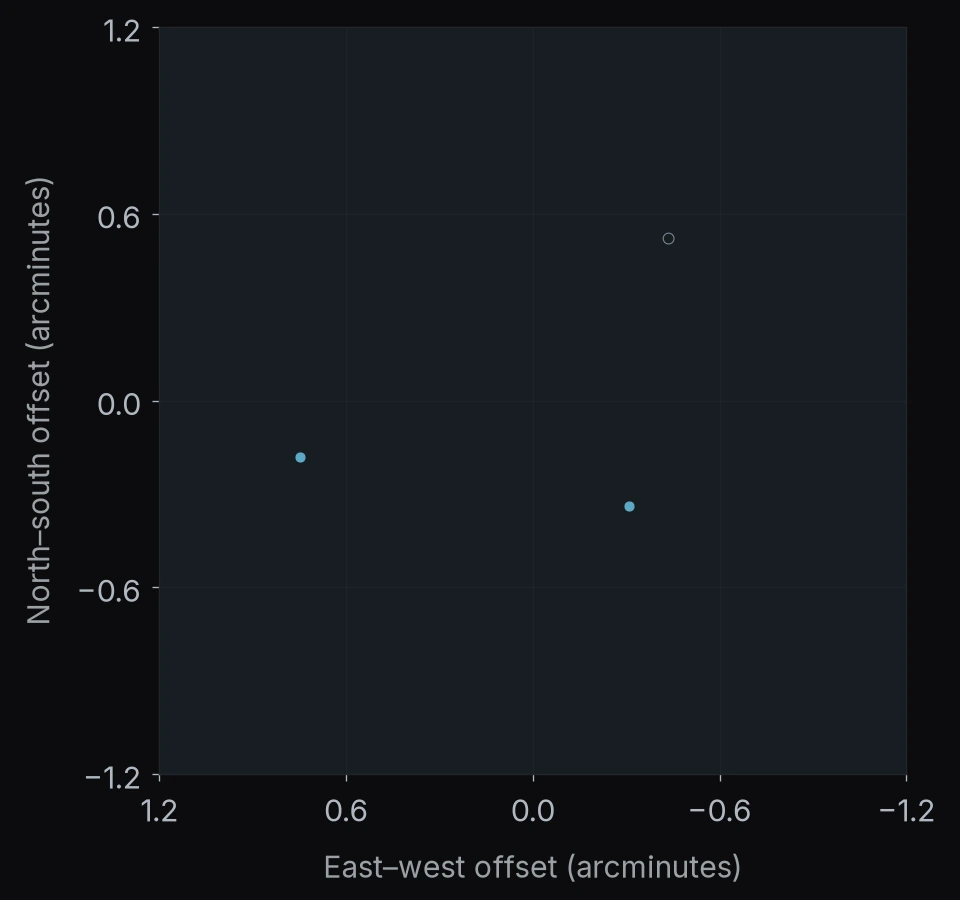
REGION 116 OF 122
POPPIES 09
3 objects
- Watch list3
North is up · east is left.
Axes show angular offsets from the region center.
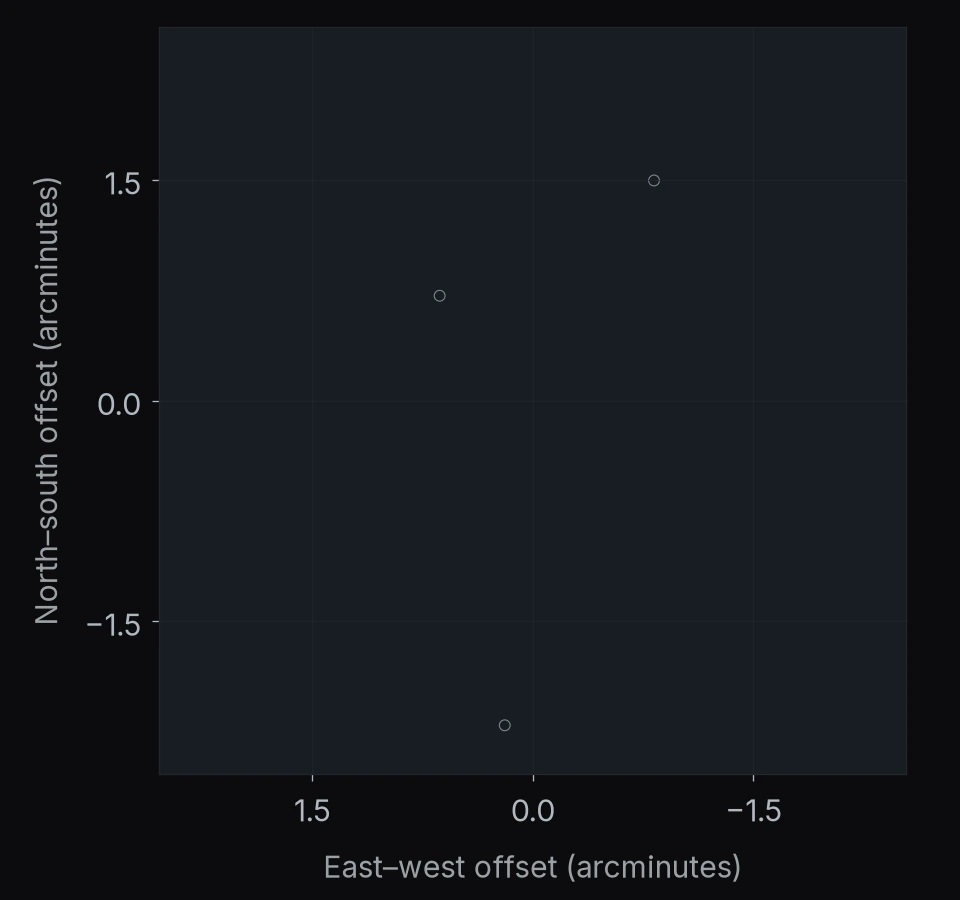
REGION 117 OF 122
RA 231.95° Dec +6.89°
3 objects
- Watch list3
North is up · east is left.
Axes show angular offsets from the region center.
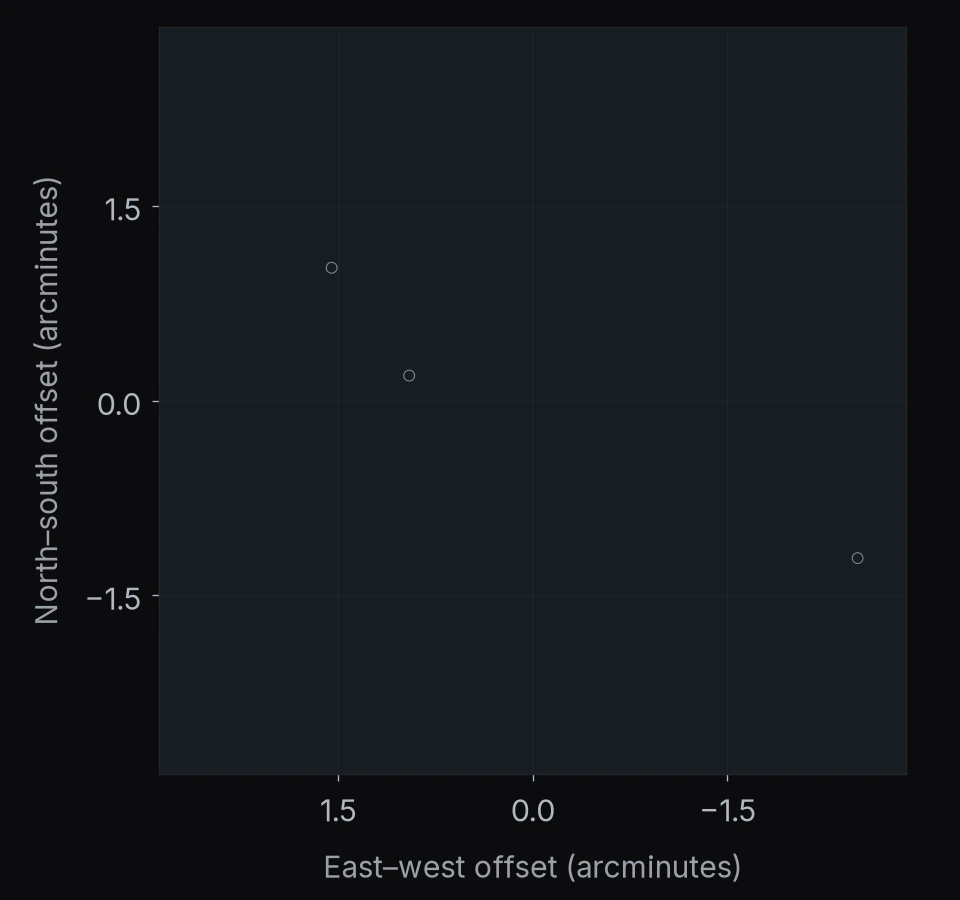
REGION 118 OF 122
POPPIES 10
2 objects
- Watch list2
North is up · east is left.
Axes show angular offsets from the region center.
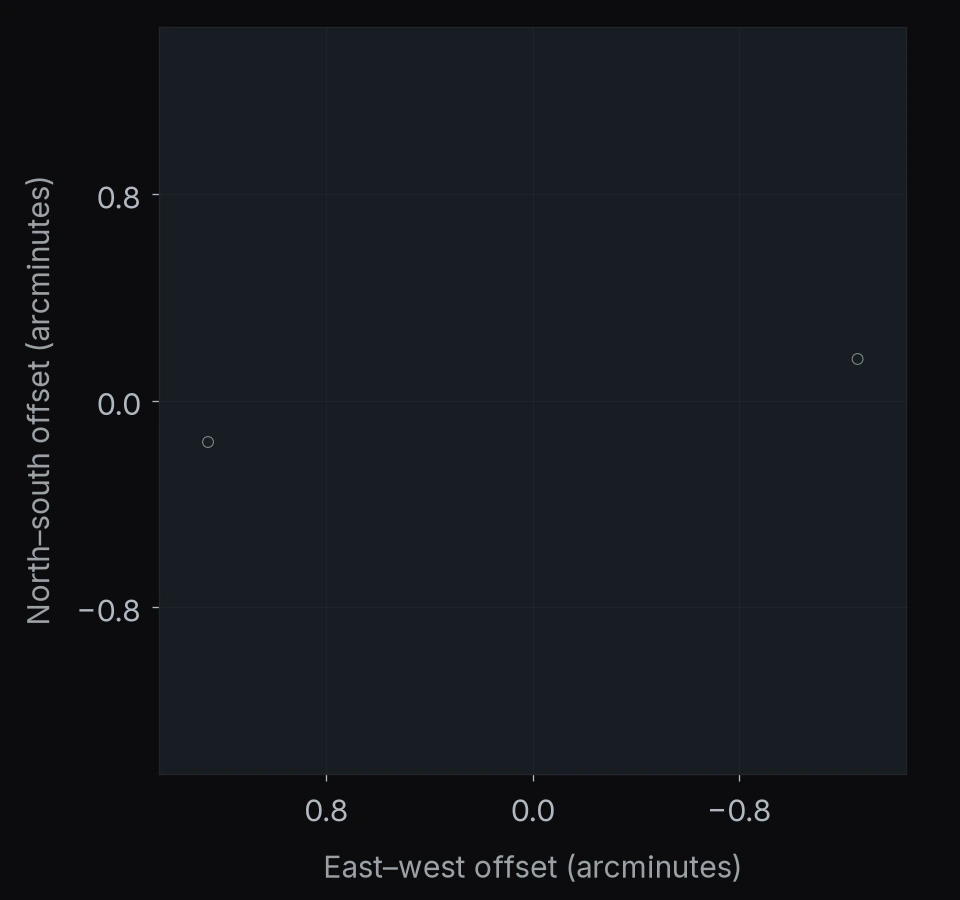
REGION 119 OF 122
PLCKG287+32.9
2 objects
- Watch list2
North is up · east is left.
Axes show angular offsets from the region center.
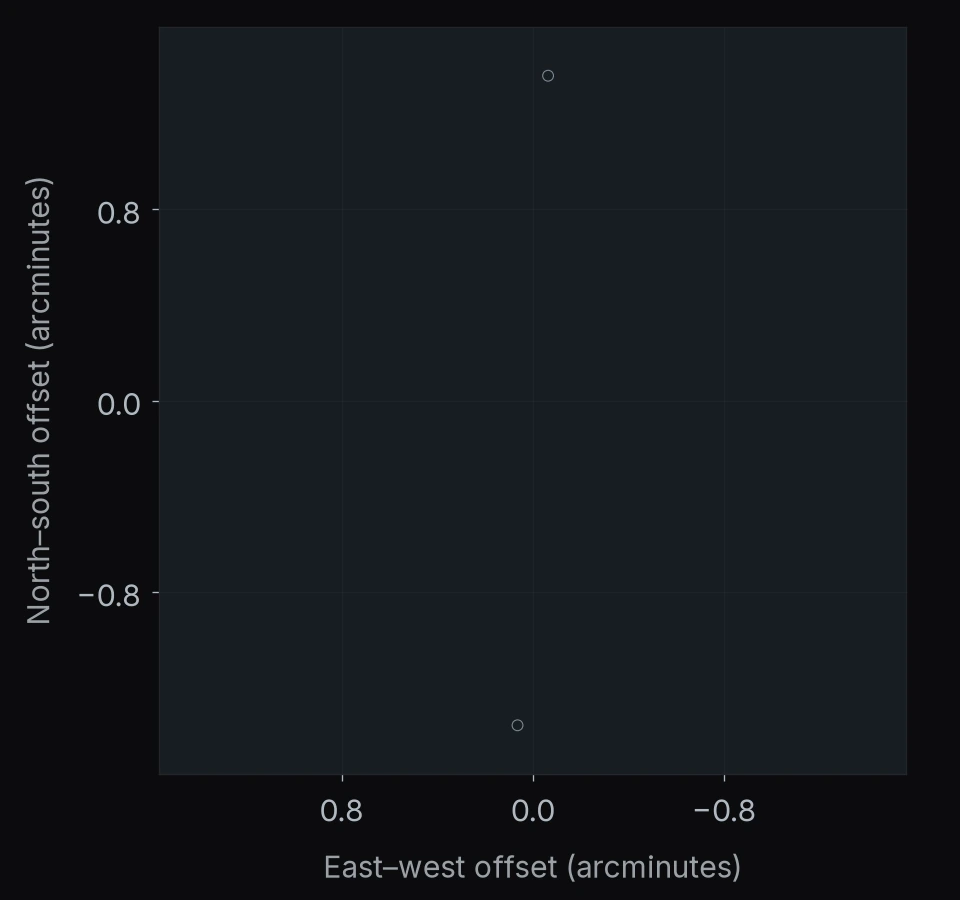
REGION 120 OF 122
POPPIES 04
2 objects
- Watch list2
North is up · east is left.
Axes show angular offsets from the region center.
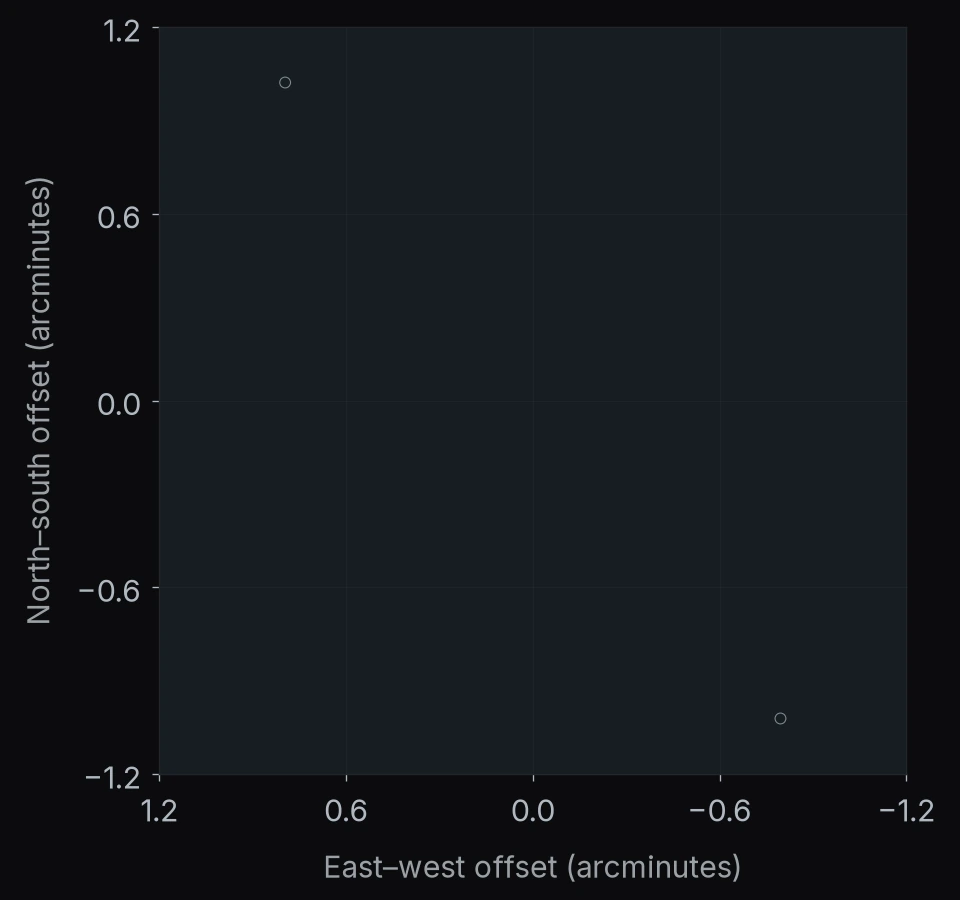
REGION 121 OF 122
RA 38.92° Dec -5.56°
1 object
- Watch list1
North is up · east is left.
Axes show angular offsets from the region center.
REGION 122 OF 122
RA 182.93° Dec -1.32°
1 object
- Watch list1
North is up · east is left.
Axes show angular offsets from the region center.
Open the complete sky-map poster ↗High-resolution figure · sources and counting methods included

Counts, categories & vetting
This snapshot covers 122 mapped sky regions, with entries from 218 field datasets.
6576 pipeline entries resolve to 4266 objects by matching positions within one arcsecond. Each object appears in one category:
- Recovered · 449 Independently measured within one arcsecond of a published JWST position: one of the twelve little-red-dot catalogs or a broad-line AGN from NIRSpec and grism samples. Recovery is not a new discovery.
- Selected after vetting · 790 Passed the pipeline’s image checks, including artifacts, neighboring sources and split exposures.
- BH* selection below redshift 3 · 69 Passed those checks and fit a black-hole-star template. This selection searches from redshift 1.5, but purity has been measured only above 3. Two of these picks have spectroscopic redshifts of 2.3 and 2.7.
- Watch list · 2958 Still uncertain after assessment.
- Awaiting vetting · 0 Initial selection output with no later-stage assessment. A BH* template match stays here until its image checks run.
When an object appears in several fields or stages, published recovery takes precedence, then selected, BH* below redshift 3, watch list and awaiting vetting. It is counted once.
Exclusions and search coverage
Centaurus A is excluded from the map. In this nearby galaxy, JWST resolves individual stars that can enter a compact-red-source selection. Of 2771 such entries, 2,110 were blocked upstream and 661 remain in the search output but are omitted here.
Known brown dwarfs are vetoed during candidate vetting. A second, one-arcsecond screen checks surviving map entries against Hainline et al. (2025/2026) and other published JWST brown-dwarf lists. Additional map exclusions — entries: 0; matched brown-dwarf positions: 0. These counts cover only the final screen, not the upstream vetting veto. An audited upstream rejection total is not included in this snapshot. Uncataloged contaminants can remain.
As on the published map, regions use one-degree links between source positions. The dataset count covers fields represented in this output; it is not a tally of all observations searched.
Methods, validation & access
Selection: measure sources in public JWST images, select compact red candidates using colors and black-hole-star models, check the images, and compare positions with published catalogs.
Photometry: the working catalog uses 0.16″-radius circular apertures with a 0.40–0.65″ local background annulus, and a noise scale measured from empty apertures in each field. These are aperture measurements, not total fluxes. The fraction of light captured changes with filter, so aperture corrections matter when comparing colors with another catalog.
Validation: recovering a known source tests the process, but does not measure completeness. Recoveries include LRDs and broad-line active galactic nuclei; the published map contains only the twelve LRD catalogs. A recovery fraction needs a matching reference sample restricted to usable searched imaging, including fields with no returned candidates. That denominator has not yet been audited.
Cluster fields: bright cluster-galaxy light, compact foreground members and multiple lensed images can mimic or duplicate candidates. Vetting checks artifacts, neighboring-source overlap and split exposures; flagged neighboring light keeps an object on the watch list pending deblended photometry. These checks do not establish background membership or merge multiple images of one lensed source.
Public access: the maps expose positions, selection categories and contributing selection routes and literature-match distances. Download the position index (JSON): ICRS right ascension and declination in degrees, with sample, category and region. The full pipeline, photometry and validation records remain unpublished, so the selection, completeness and contamination rate cannot yet be independently audited. Classifications may change as vetting continues.
For the underlying measurements or selection procedure, request a dated catalog subset and method.
The published population
Positions and original selections from twelve catalogs, including MoM-BH*-1.
See the whole sky
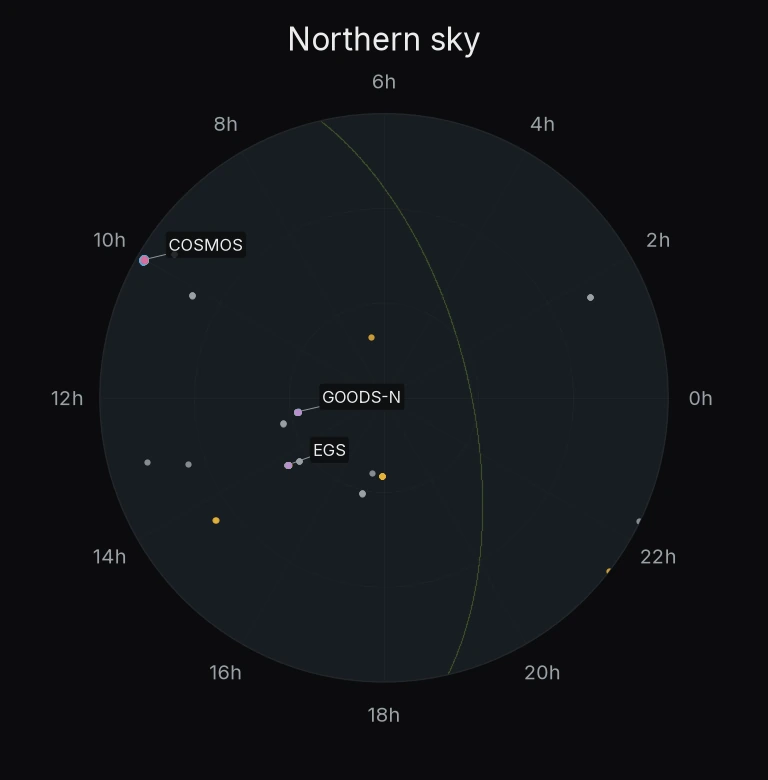
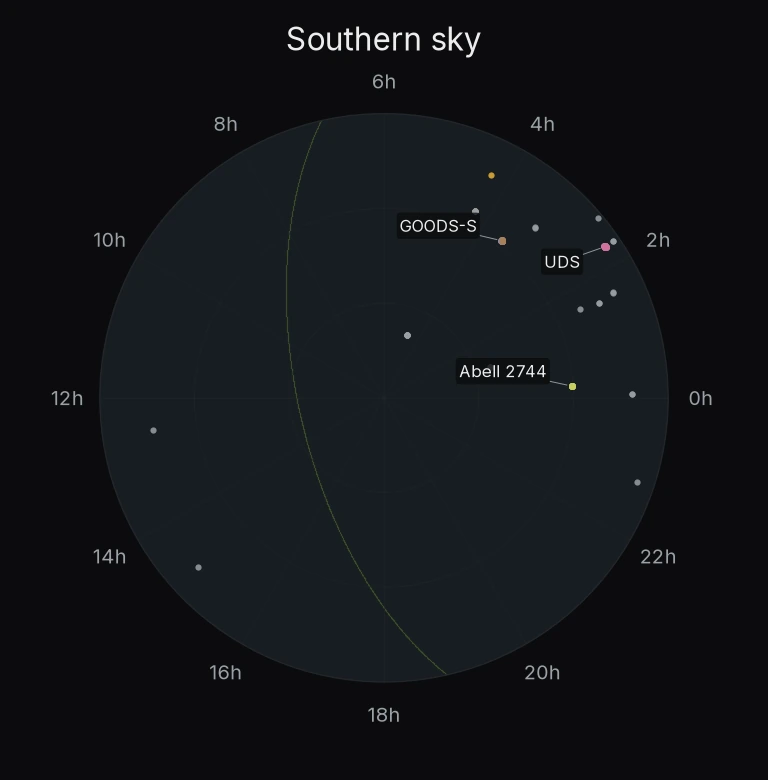
- Akins+24 COSMOS-Web434
- Kocevski+24341
- Kokorev+24260
- Leung+24 PRIMER100
- Rinaldi+24 GOODS99
- de Graaff+25134
- Barro+25118
- Weibel+26 BH*241
- Matthee+2618
- Barro+26 MIRI fields189
- Labbé+25 UNCOVER35
- Pérez-González+24 SMILES31
Every plotted position is shown. Rings mark 30° and 60° from the pole; the muted green arc is the Galactic plane. These are source maps, not survey footprints.
REGION 1 OF 34
COSMOS
789 catalog entries
- Akins+24 COSMOS-Web434
- Kocevski+2481
- Kokorev+2478
- Leung+24 PRIMER38
- de Graaff+2520
- Barro+2515
- Weibel+26 BH*61
- Barro+26 MIRI fields62
North is up · east is left.
Axes show angular offsets from the region center.
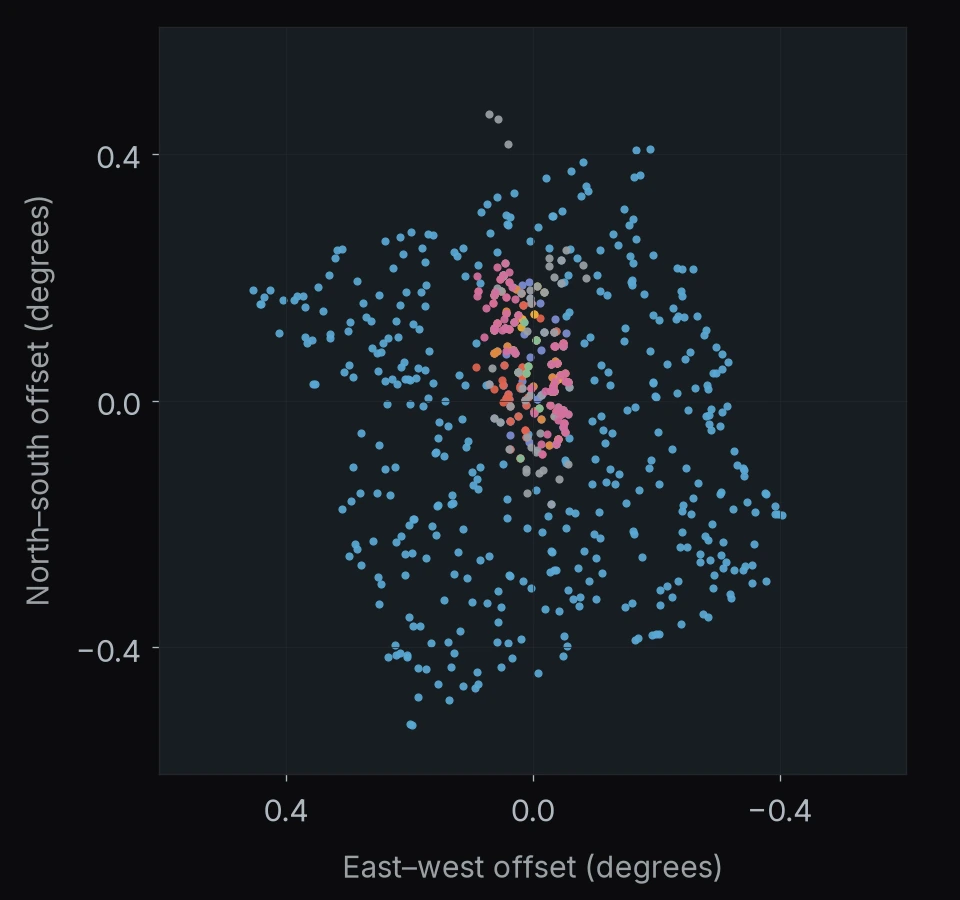
REGION 1 OF 34
COSMOS
789 catalog entries
- Akins+24 COSMOS-Web434
- Kocevski+2481
- Kokorev+2478
- Leung+24 PRIMER38
- de Graaff+2520
- Barro+2515
- Weibel+26 BH*61
- Barro+26 MIRI fields62
North is up · east is left.
Axes show angular offsets from the region center.
REGION 2 OF 34
UDS
509 catalog entries
- Kocevski+24117
- Kokorev+24111
- Leung+24 PRIMER62
- de Graaff+2531
- Barro+2533
- Weibel+26 BH*59
- Matthee+263
- Barro+26 MIRI fields93
North is up · east is left.
Axes show angular offsets from the region center.
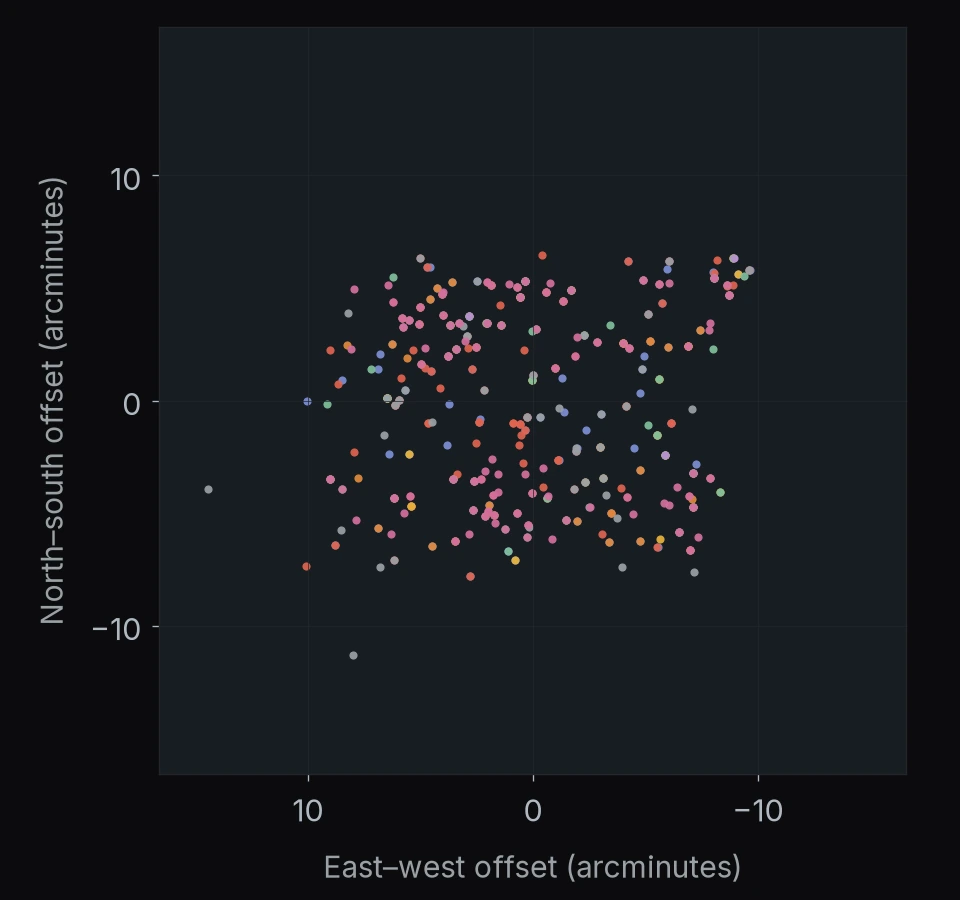
REGION 3 OF 34
GOODS-S
244 catalog entries
- Kocevski+2456
- Kokorev+2427
- Rinaldi+24 GOODS47
- de Graaff+2510
- Barro+2517
- Weibel+26 BH*20
- Matthee+262
- Barro+26 MIRI fields34
- Pérez-González+24 SMILES31
North is up · east is left.
Axes show angular offsets from the region center.
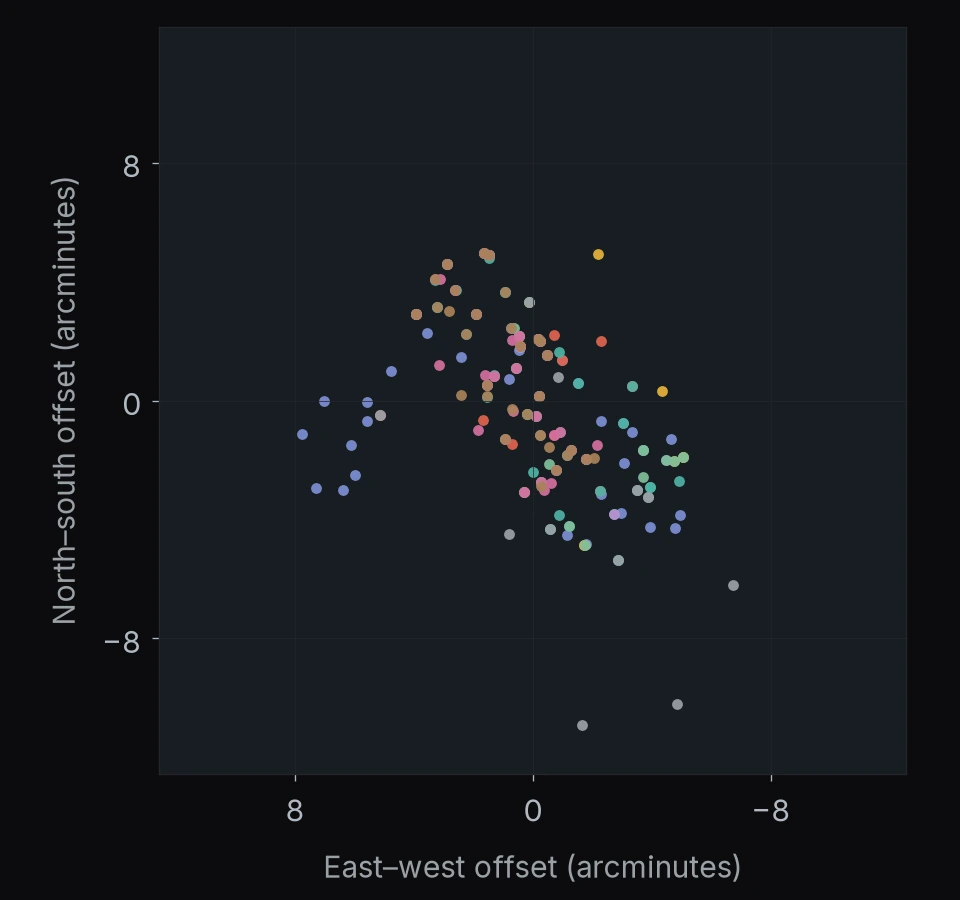
REGION 4 OF 34
EGS
192 catalog entries
- Kocevski+2464
- Kokorev+2444
- de Graaff+2533
- Barro+2525
- Weibel+26 BH*22
- Matthee+264
North is up · east is left.
Axes show angular offsets from the region center.
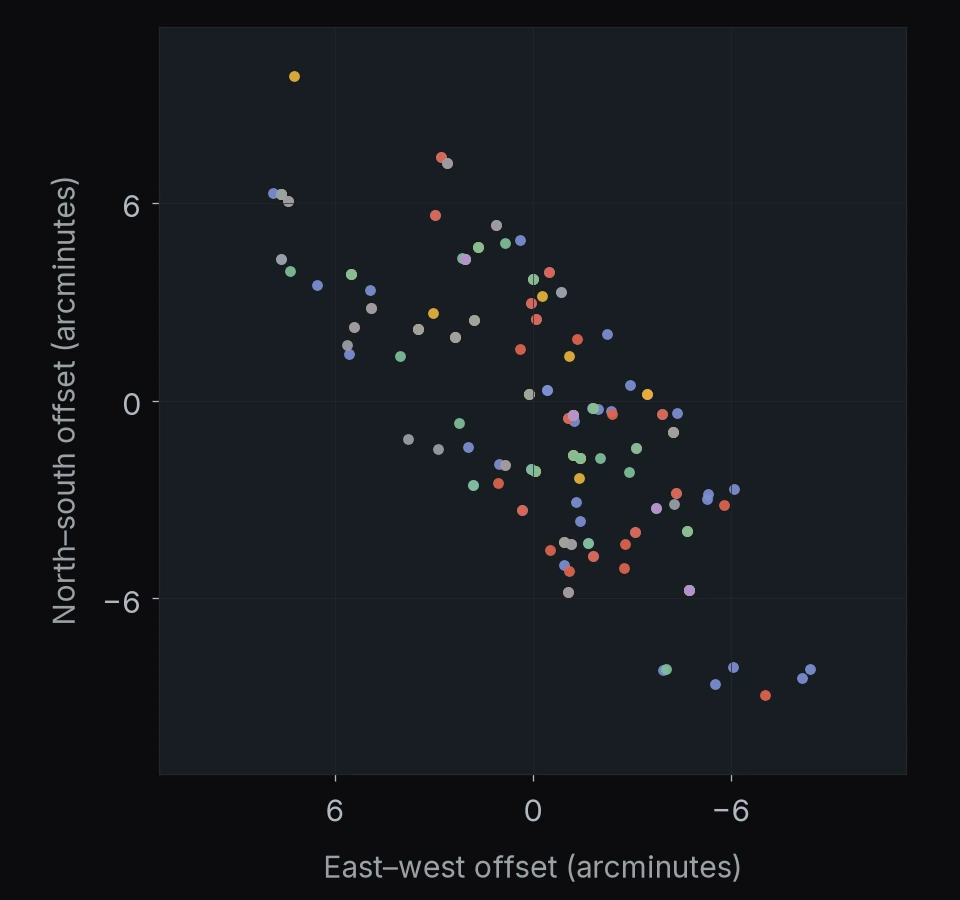
REGION 5 OF 34
GOODS-N
102 catalog entries
- Rinaldi+24 GOODS52
- de Graaff+259
- Barro+2516
- Weibel+26 BH*18
- Matthee+267
North is up · east is left.
Axes show angular offsets from the region center.
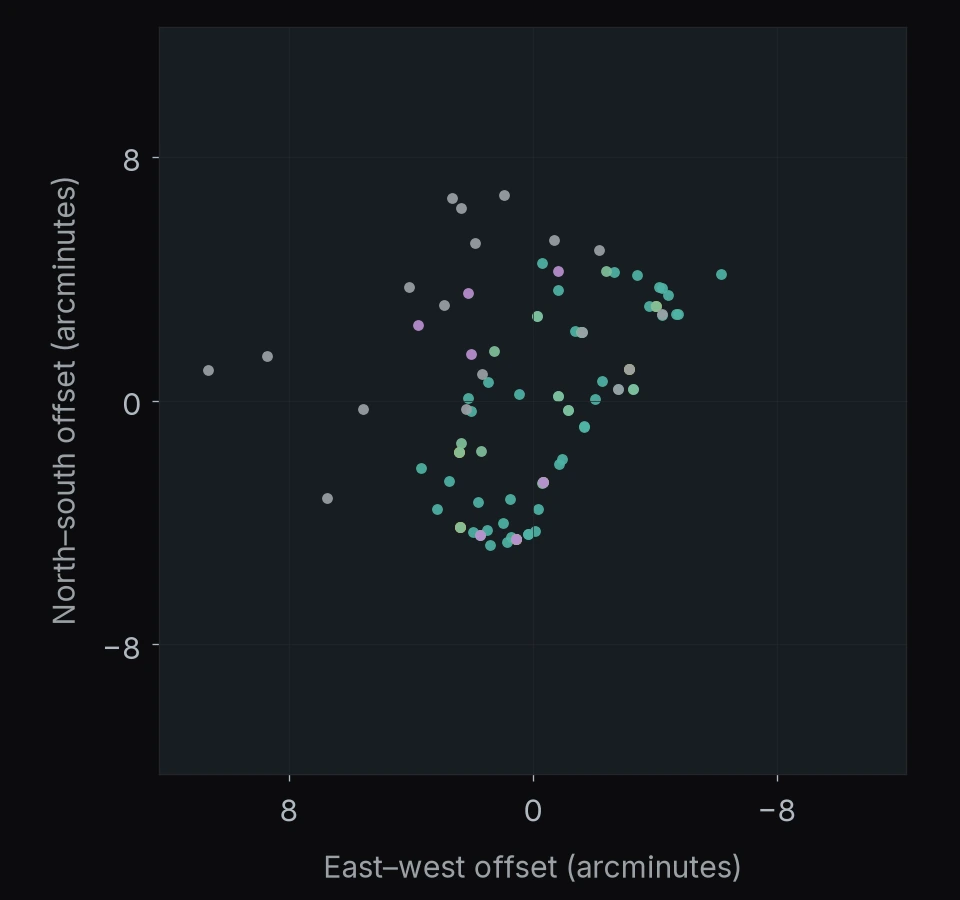
REGION 6 OF 34
Abell 2744
96 catalog entries
- Kocevski+2423
- de Graaff+2515
- Barro+2512
- Weibel+26 BH*9
- Matthee+262
- Labbé+25 UNCOVER35
North is up · east is left.
Axes show angular offsets from the region center.
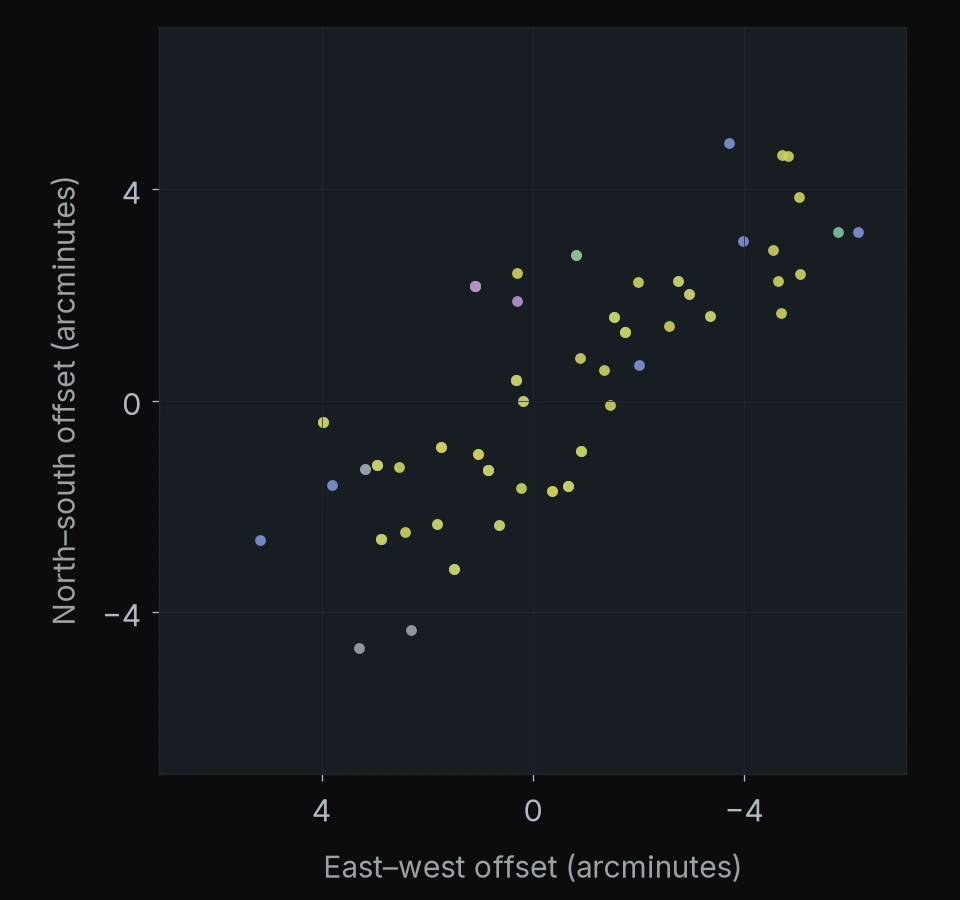
REGION 7 OF 34
RA 268.49° Dec +65.19°
9 catalog entries
- de Graaff+259
North is up · east is left.
Axes show angular offsets from the region center.
REGION 8 OF 34
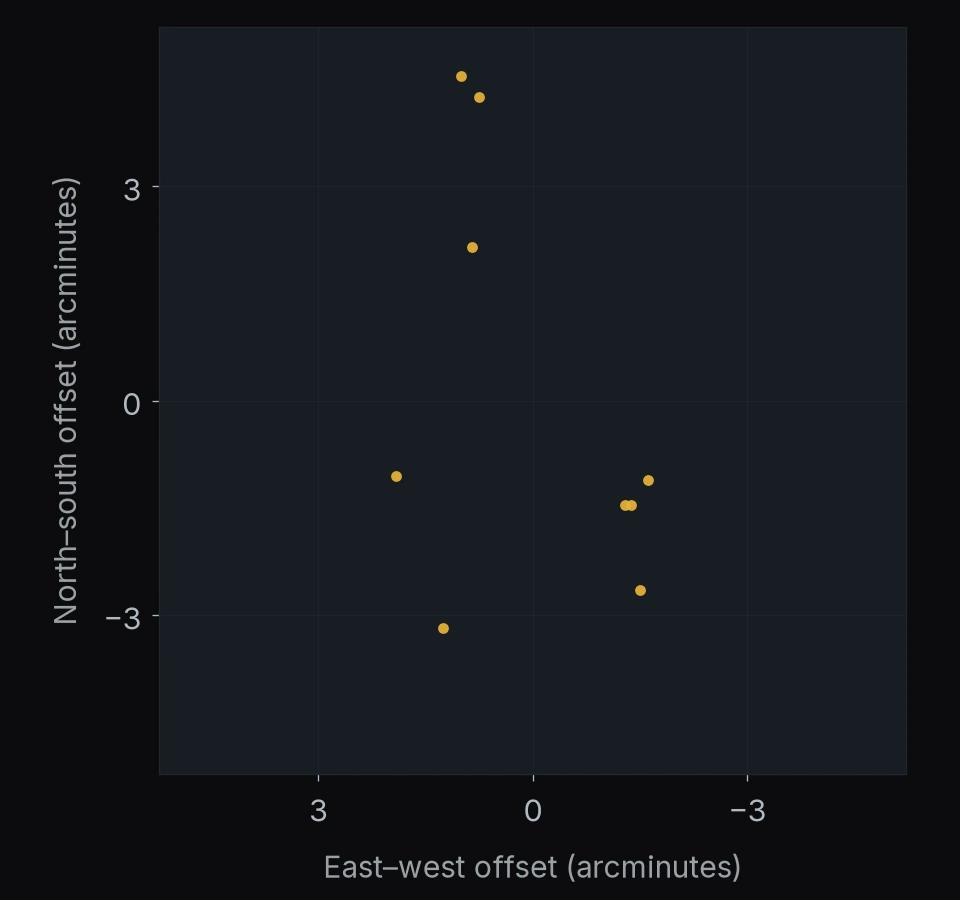
PANO-J043844M6849
6 catalog entries
- Weibel+26 BH*6
North is up · east is left.
Axes show angular offsets from the region center.
REGION 9 OF 34
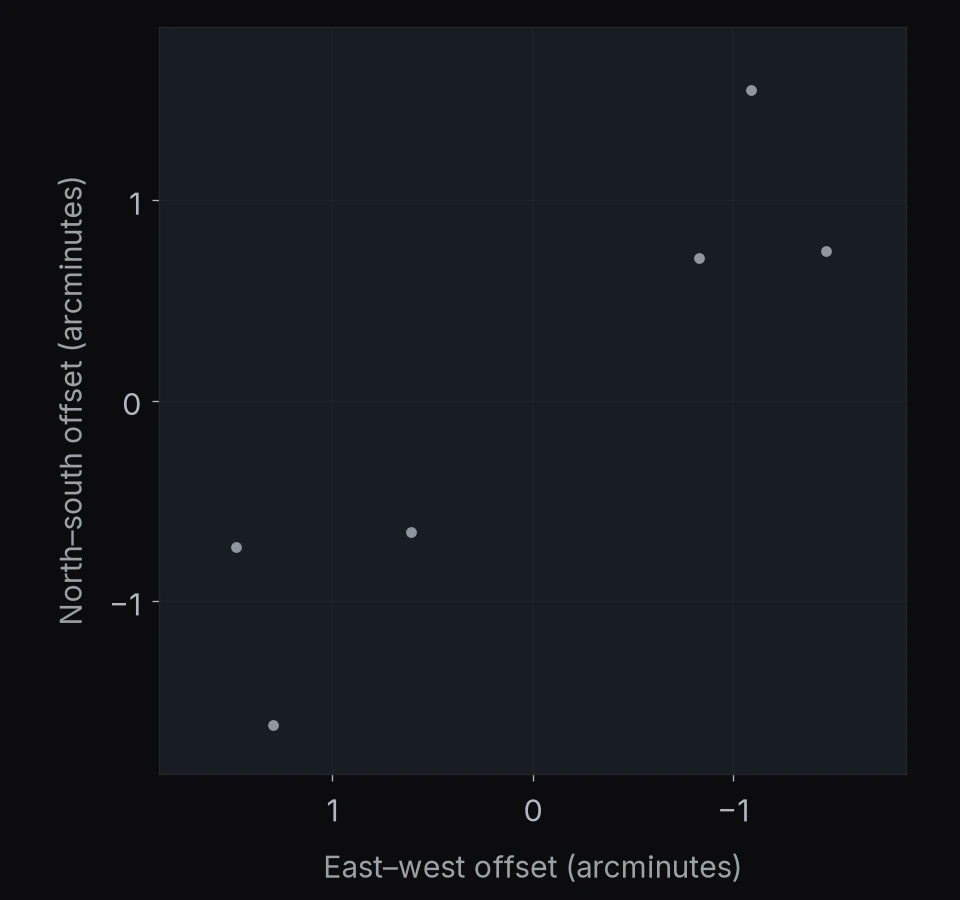
PANO-J041616M2409
5 catalog entries
- de Graaff+252
- Weibel+26 BH*3
North is up · east is left.
Axes show angular offsets from the region center.
REGION 10 OF 34
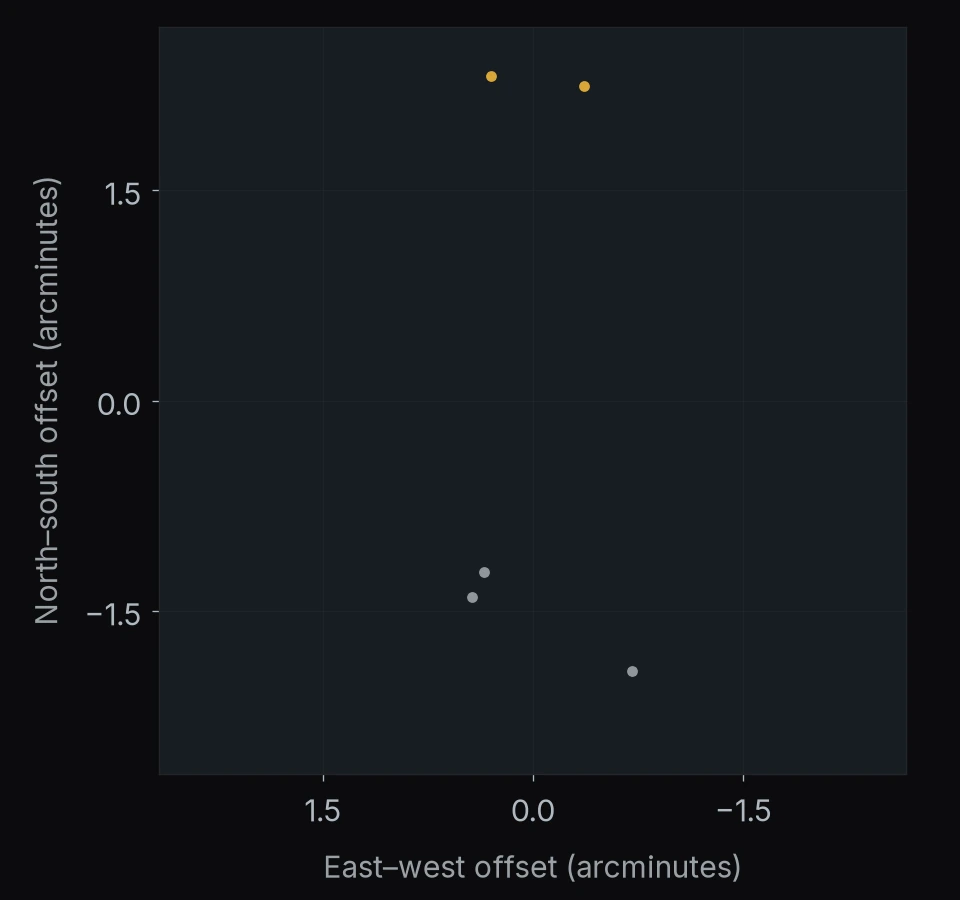
PANO-J014428P1715
4 catalog entries
- Weibel+26 BH*4
North is up · east is left.
Axes show angular offsets from the region center.
REGION 11 OF 34
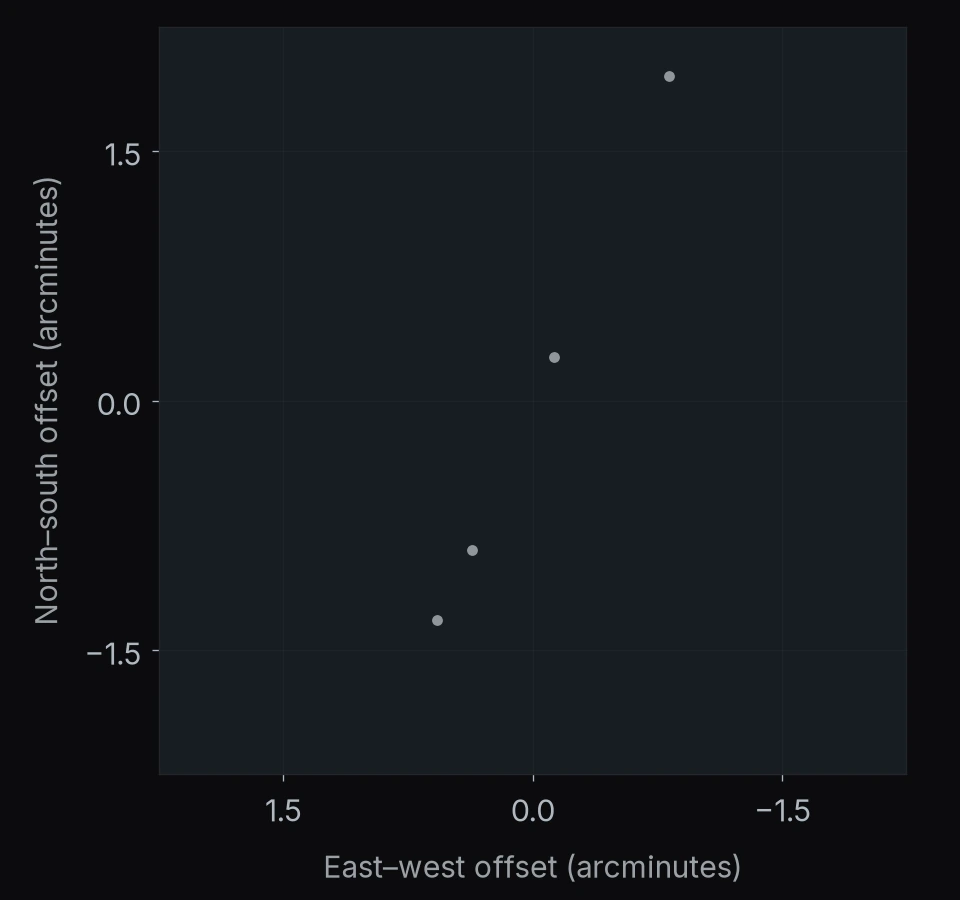
PANO-J100736P2109
4 catalog entries
- Weibel+26 BH*4
North is up · east is left.
Axes show angular offsets from the region center.
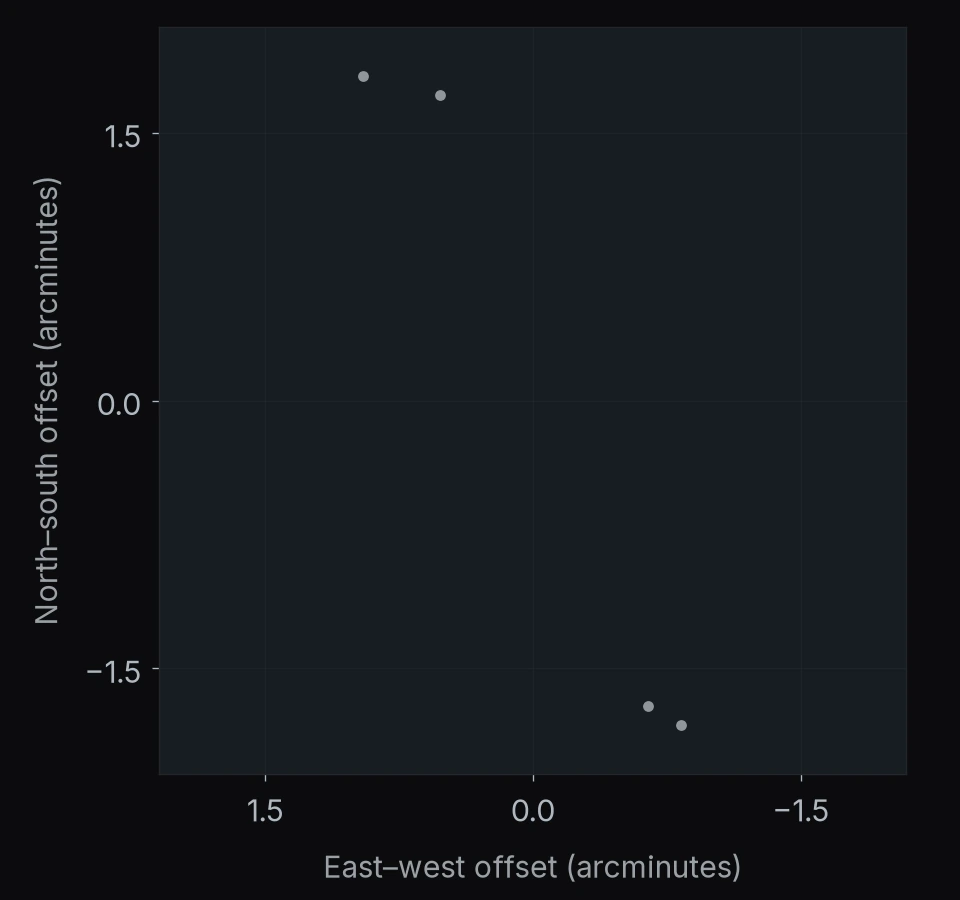
REGION 12 OF 34
PANO-J170720P5853
4 catalog entries
- Weibel+26 BH*4
North is up · east is left.
Axes show angular offsets from the region center.
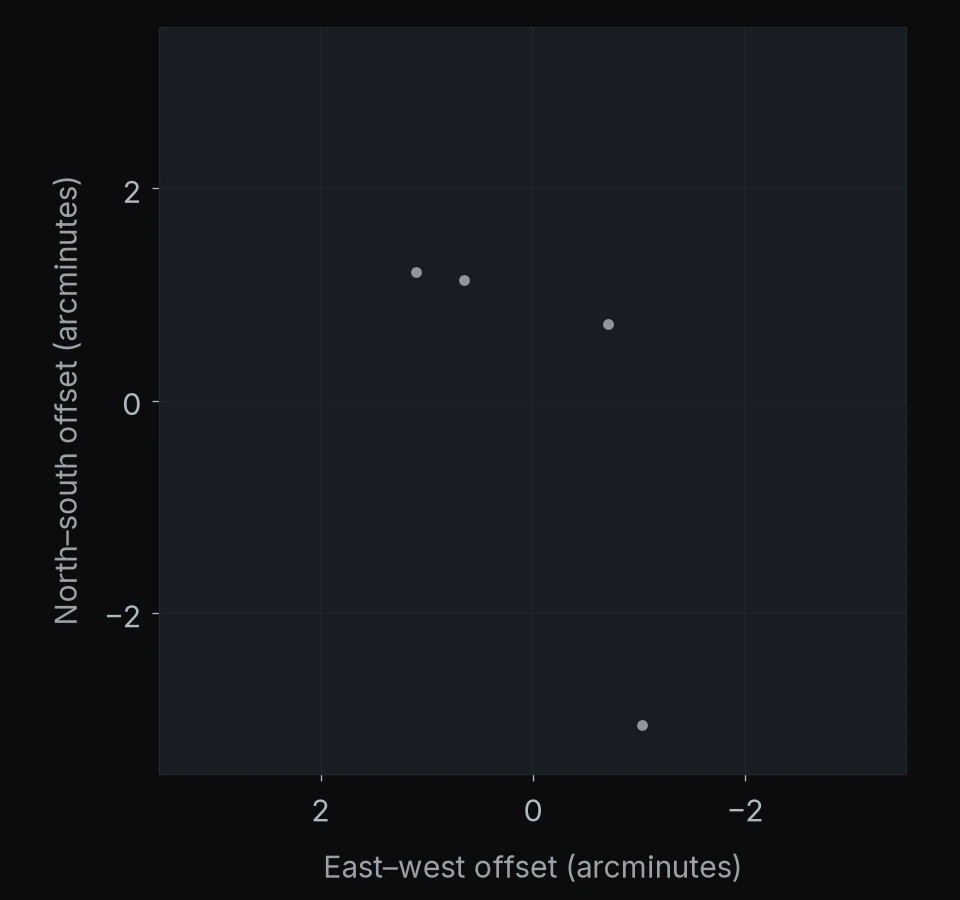
REGION 13 OF 34
PANO-J142536P5630
4 catalog entries
- Weibel+26 BH*4
North is up · east is left.
Axes show angular offsets from the region center.
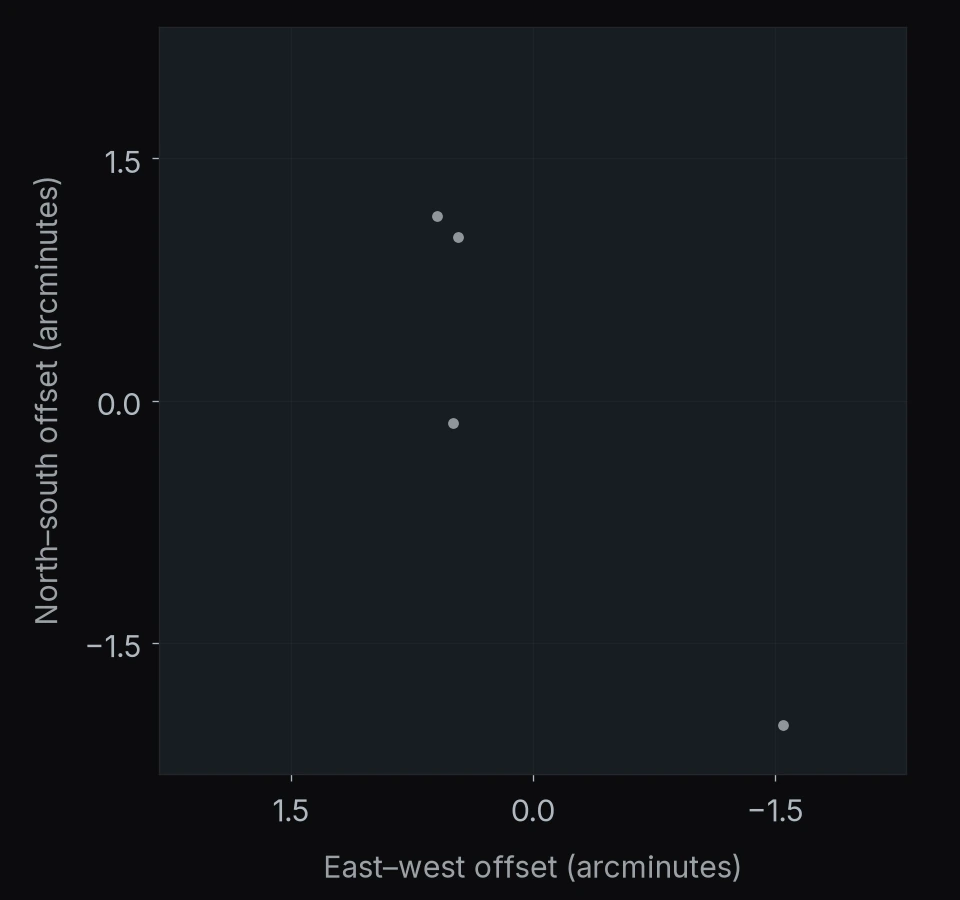
REGION 14 OF 34
PANO-J010408M5508
3 catalog entries
- Weibel+26 BH*3
North is up · east is left.
Axes show angular offsets from the region center.
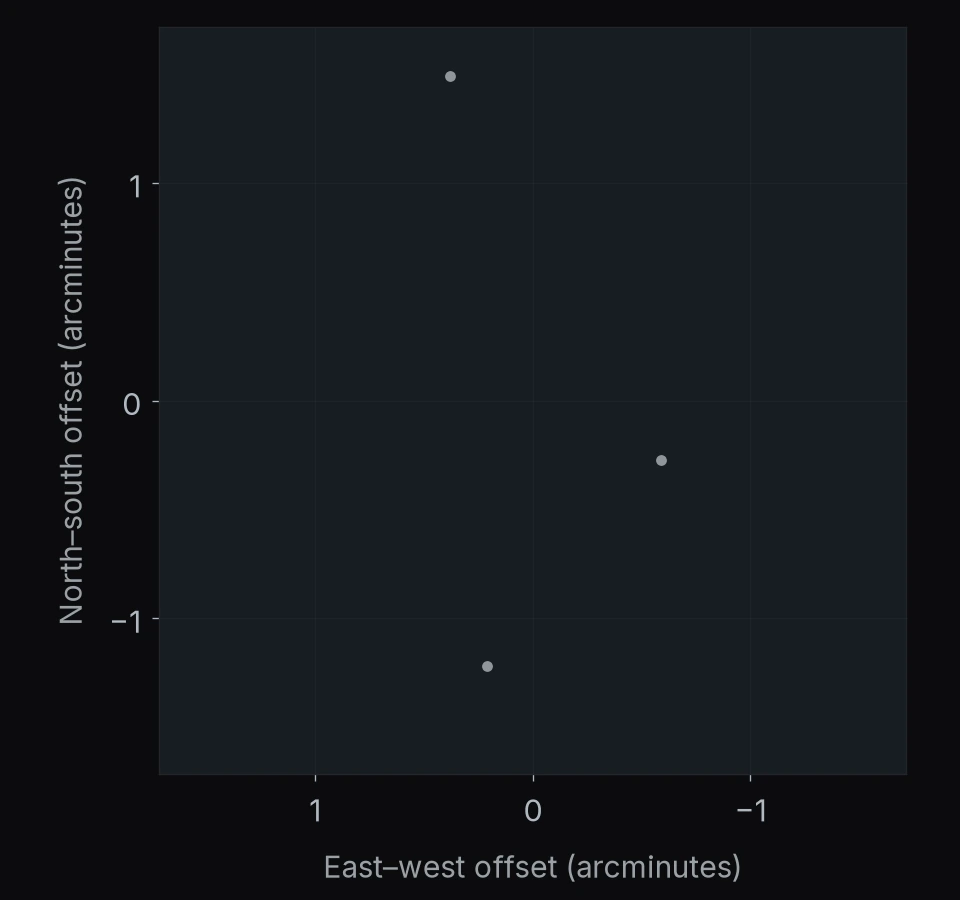
REGION 15 OF 34
PANO-J125652P5652
3 catalog entries
- Weibel+26 BH*3
North is up · east is left.
Axes show angular offsets from the region center.
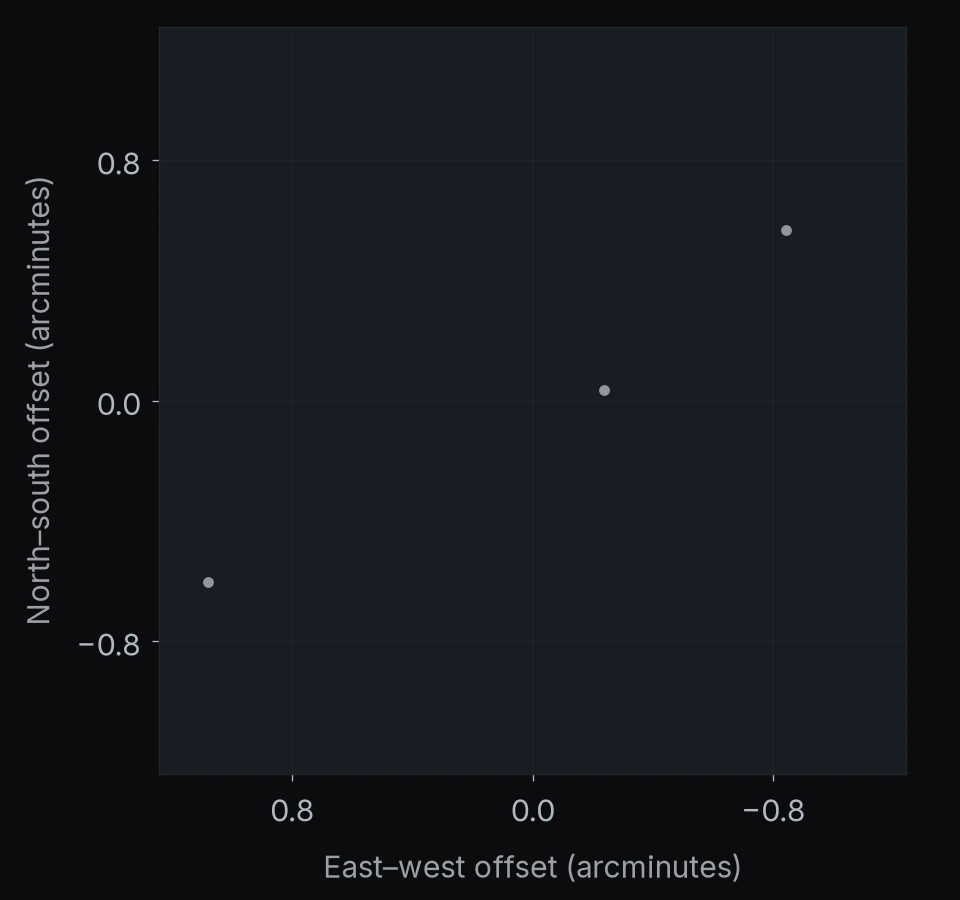
REGION 16 OF 34
PANO-J021728M0214
2 catalog entries
- Weibel+26 BH*2
North is up · east is left.
Axes show angular offsets from the region center.
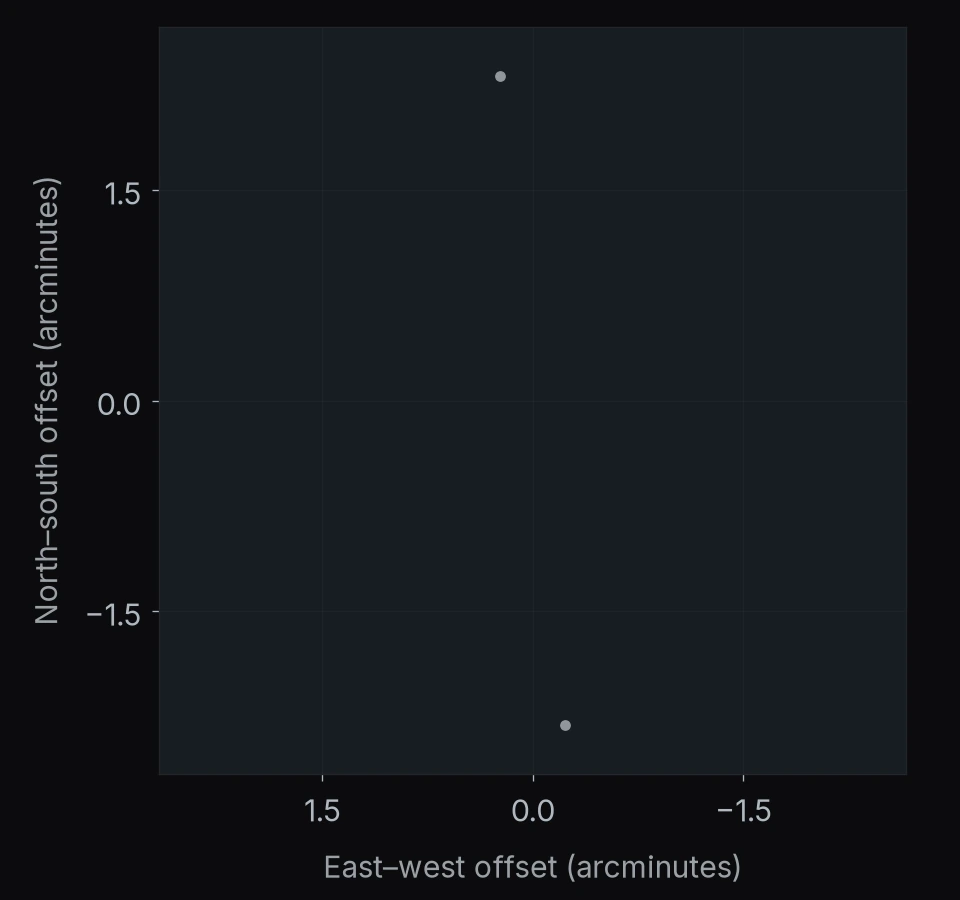
REGION 17 OF 34
PANO-J013444M1532
2 catalog entries
- Weibel+26 BH*2
North is up · east is left.
Axes show angular offsets from the region center.
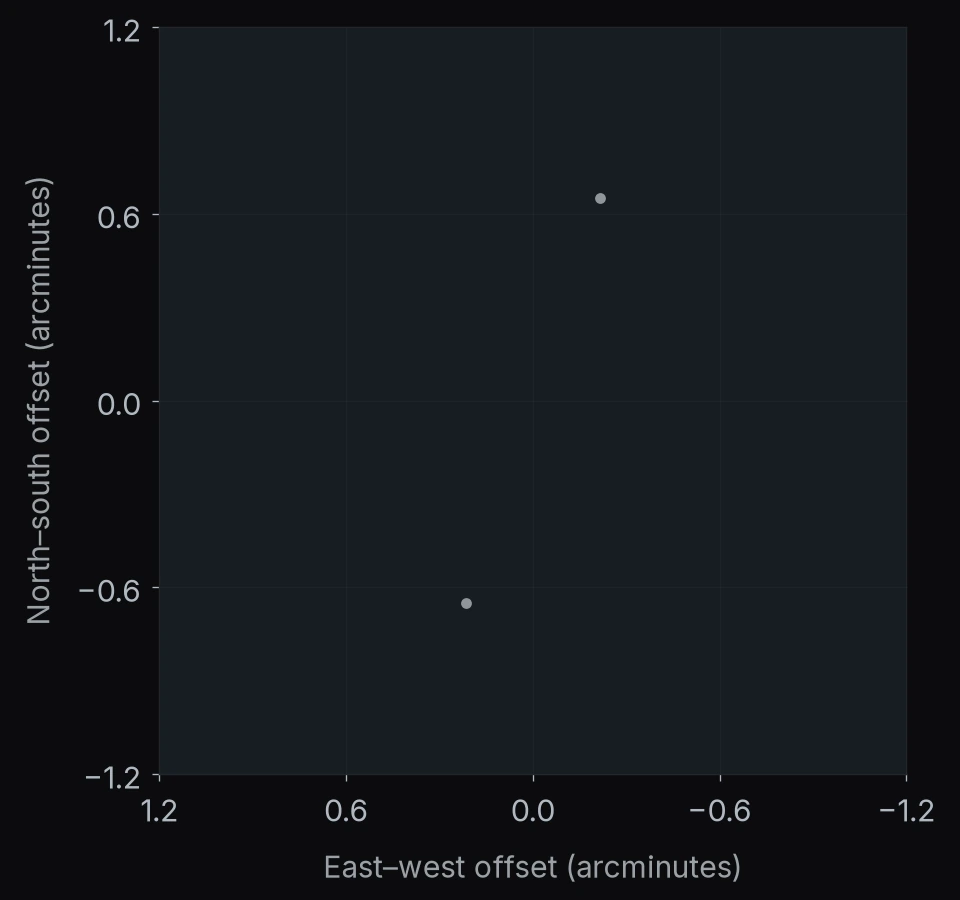
REGION 18 OF 34
PANO-J013900M1019
2 catalog entries
- Weibel+26 BH*2
North is up · east is left.
Axes show angular offsets from the region center.
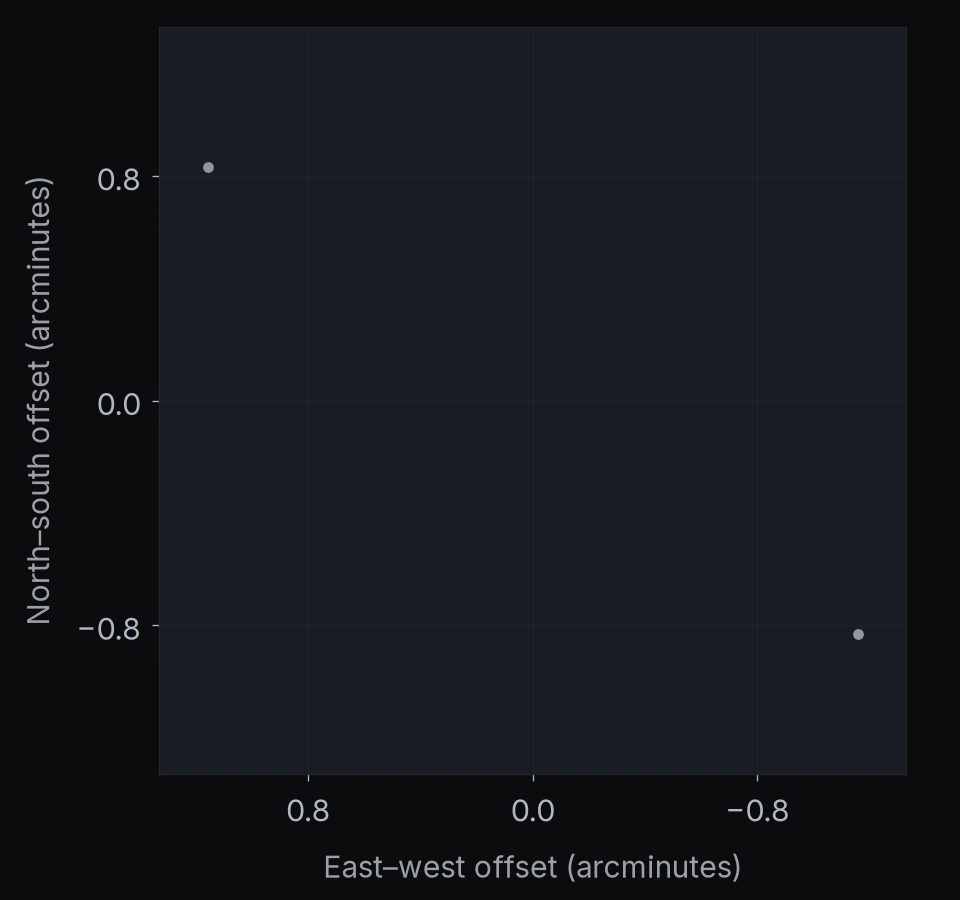
REGION 19 OF 34
PANO-J031404M1759
2 catalog entries
- Weibel+26 BH*2
North is up · east is left.
Axes show angular offsets from the region center.
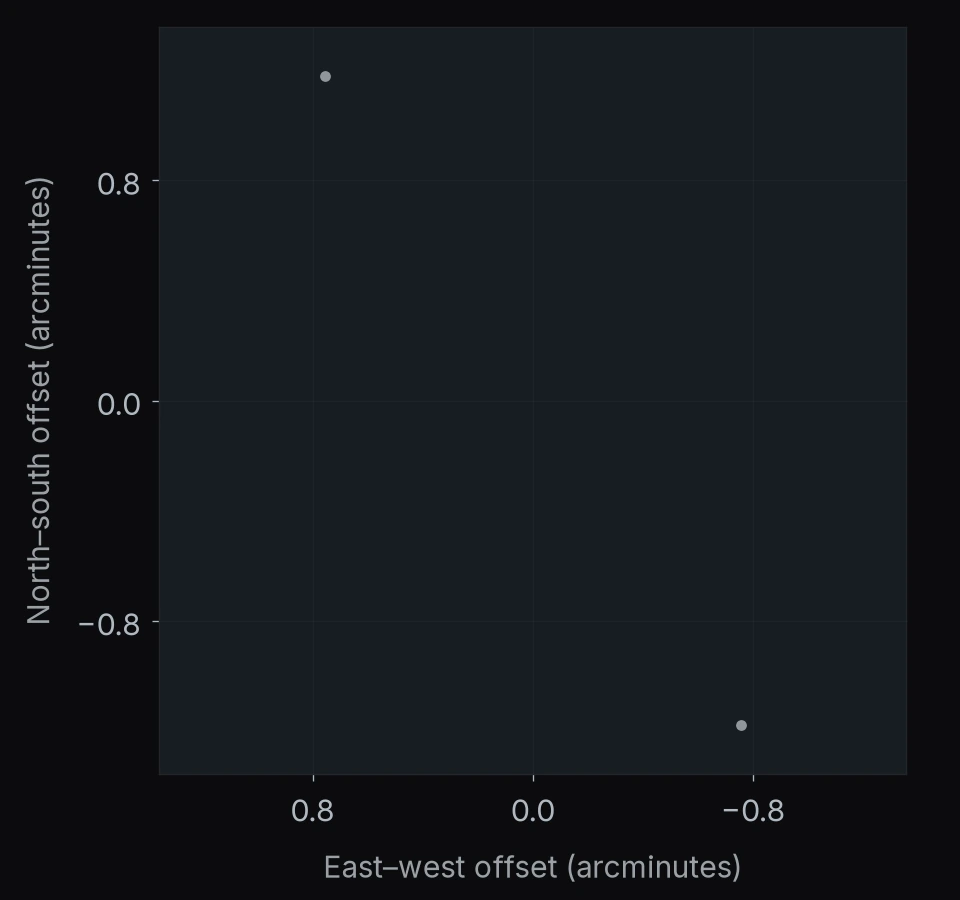
REGION 20 OF 34
PANO-J000352M1120
2 catalog entries
- Weibel+26 BH*2
North is up · east is left.
Axes show angular offsets from the region center.
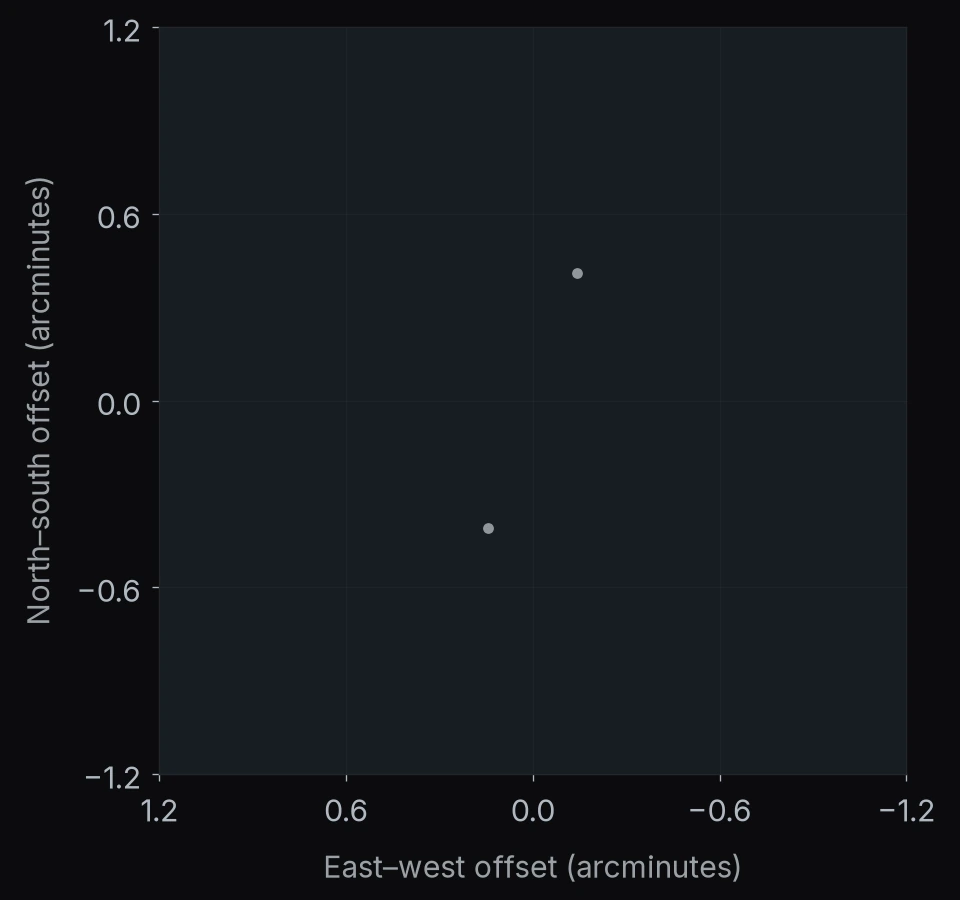
REGION 21 OF 34
PANO-J094232P0923
2 catalog entries
- Weibel+26 BH*2
North is up · east is left.
Axes show angular offsets from the region center.
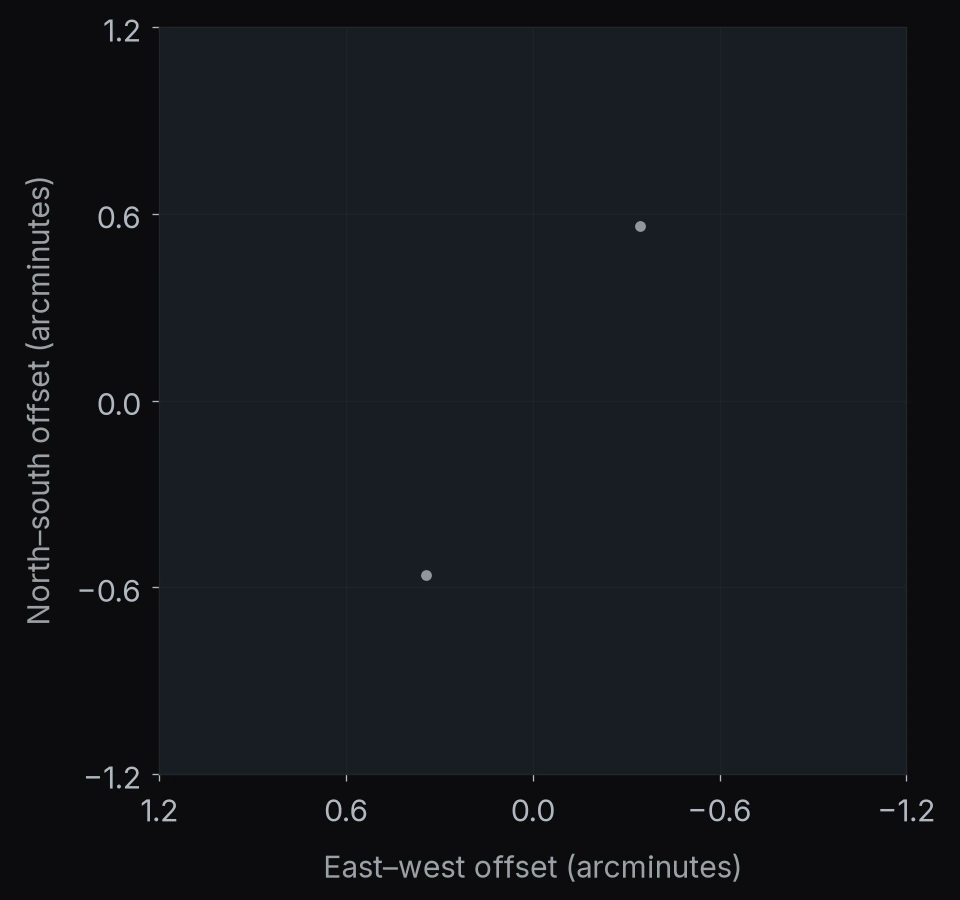
REGION 22 OF 34
MACS J1423+2404
2 catalog entries
- de Graaff+252
North is up · east is left.
Axes show angular offsets from the region center.
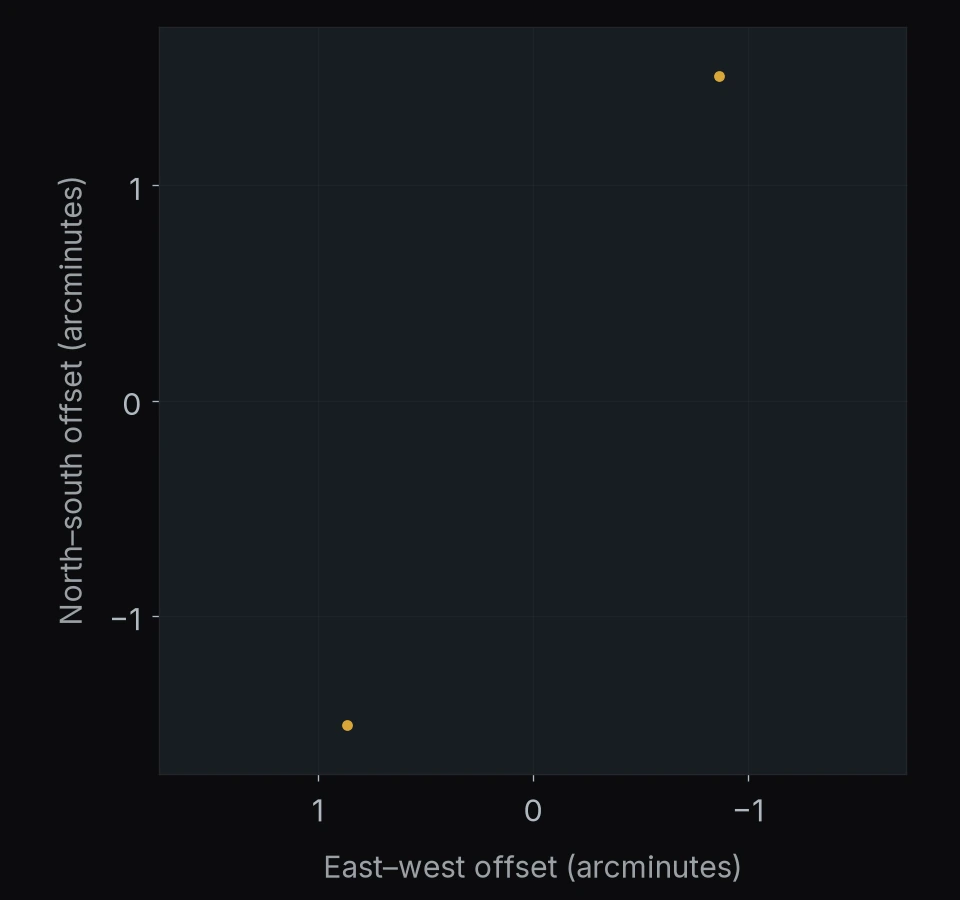
REGION 23 OF 34
PANO-J024000M0142
1 catalog entry
- Weibel+26 BH*1
North is up · east is left.
Axes show angular offsets from the region center.
REGION 24 OF 34
PANO-J013748M2152
1 catalog entry
- Weibel+26 BH*1
North is up · east is left.
Axes show angular offsets from the region center.
REGION 25 OF 34
MACS J0417−1154
1 catalog entry
- de Graaff+251
North is up · east is left.
Axes show angular offsets from the region center.
REGION 26 OF 34
PANO-J224616M0531
1 catalog entry
- Weibel+26 BH*1
North is up · east is left.
Axes show angular offsets from the region center.
REGION 27 OF 34
PANO-J221700P0025
1 catalog entry
- Weibel+26 BH*1
North is up · east is left.
Axes show angular offsets from the region center.
REGION 28 OF 34
RA 322.42° Dec +0.10°
1 catalog entry
- de Graaff+251
North is up · east is left.
Axes show angular offsets from the region center.
REGION 29 OF 34
PANO-J131432P2432
1 catalog entry
- Weibel+26 BH*1
North is up · east is left.
Axes show angular offsets from the region center.
REGION 30 OF 34
PANO-J130016P1215
1 catalog entry
- Weibel+26 BH*1
North is up · east is left.
Axes show angular offsets from the region center.
REGION 31 OF 34
NEP-TDF
1 catalog entry
- Weibel+26 BH*1
North is up · east is left.
Axes show angular offsets from the region center.
REGION 32 OF 34
PANO-J123140M1618
1 catalog entry
- Weibel+26 BH*1
North is up · east is left.
Axes show angular offsets from the region center.
REGION 33 OF 34
RA 101.93° Dec +70.20°
1 catalog entry
- de Graaff+251
North is up · east is left.
Axes show angular offsets from the region center.
REGION 34 OF 34
PANO-J144904M1017
1 catalog entry
- Weibel+26 BH*1
North is up · east is left.
Axes show angular offsets from the region center.
Open the complete sky-map poster ↗High-resolution figure · sources and counting methods included

How entries, objects and sky regions are counted
The 2,000 catalog entries represent 1,201 distinct objects at a one-arcsecond positional match, grouped into 34 mapped sky regions. Six deep fields contain 97% of the entries. Repeated appearances in different papers count as separate entries, so the object total is smaller.
These maps show source locations. Mapped regions link neighboring positions within one degree; they are display groups, not telescope pointings or survey footprints. No sky-coverage percentage is inferred from them.
Beyond JWST
Euclid and DESI extend the comparison to different depths and redshifts.
See the whole sky
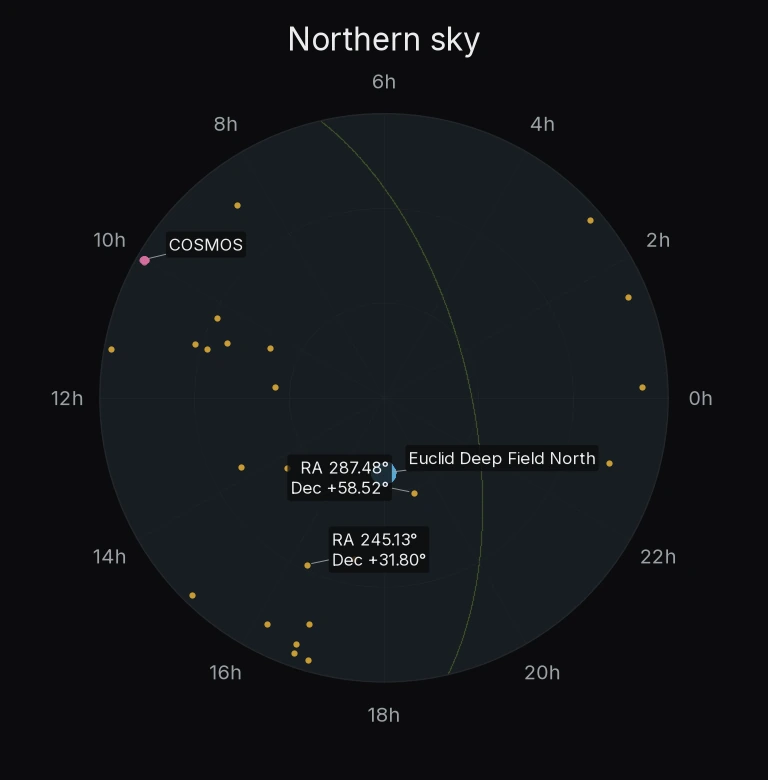
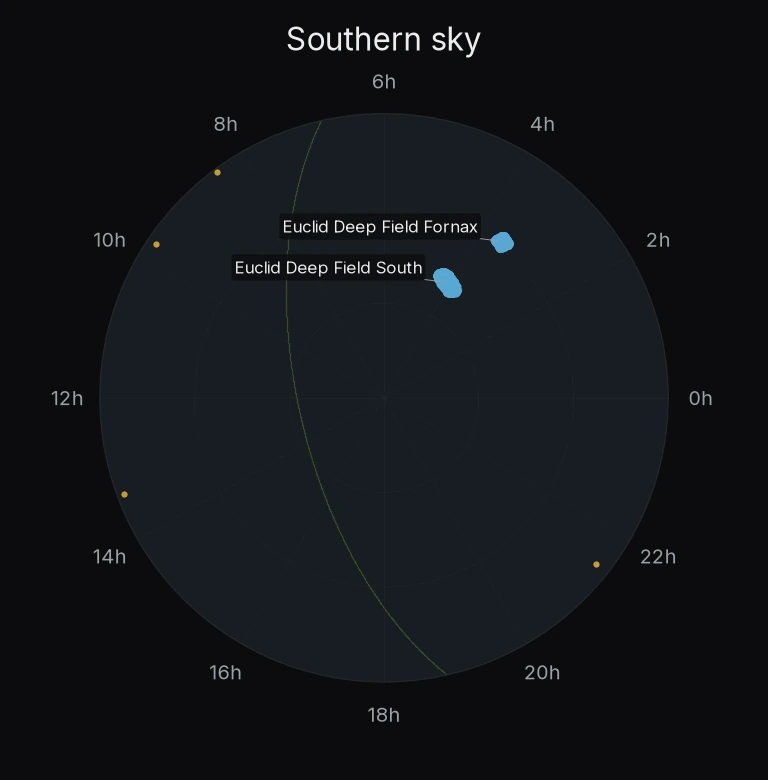
- Euclid Q1 (Bisigello+25 / Euclid Coll.)3,341
- DESI DR1 low-z (Lin+26)27
- Euclid COSMOS z > 4 (Tumborang+26 / Euclid Coll.)16
Every plotted position is shown. Rings mark 30° and 60° from the pole; the muted green arc is the Galactic plane. These are source maps, not survey footprints.
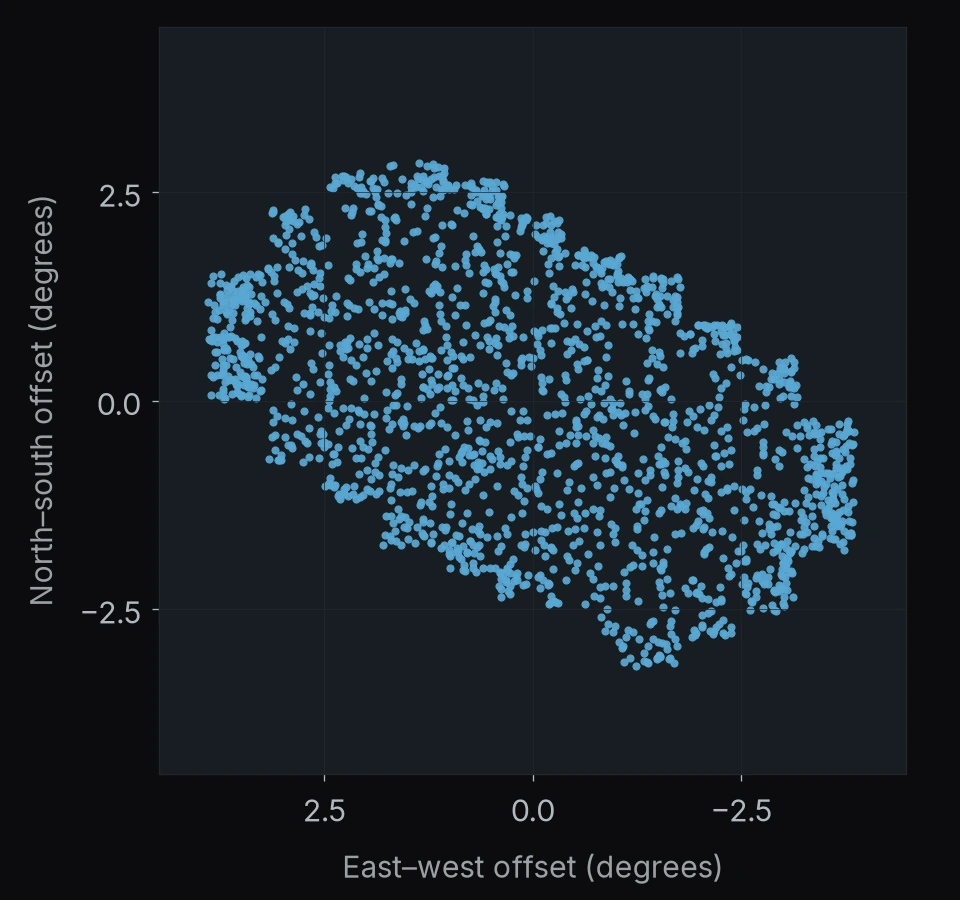
REGION 1 OF 31
Euclid Deep Field South
1,940 catalog entries
- Euclid Q1 (Bisigello+25 / Euclid Coll.)1,940
North is up · east is left.
Axes show angular offsets from the region center.
REGION 1 OF 31
Euclid Deep Field South
1,940 catalog entries
- Euclid Q1 (Bisigello+25 / Euclid Coll.)1,940
North is up · east is left.
Axes show angular offsets from the region center.
REGION 2 OF 31
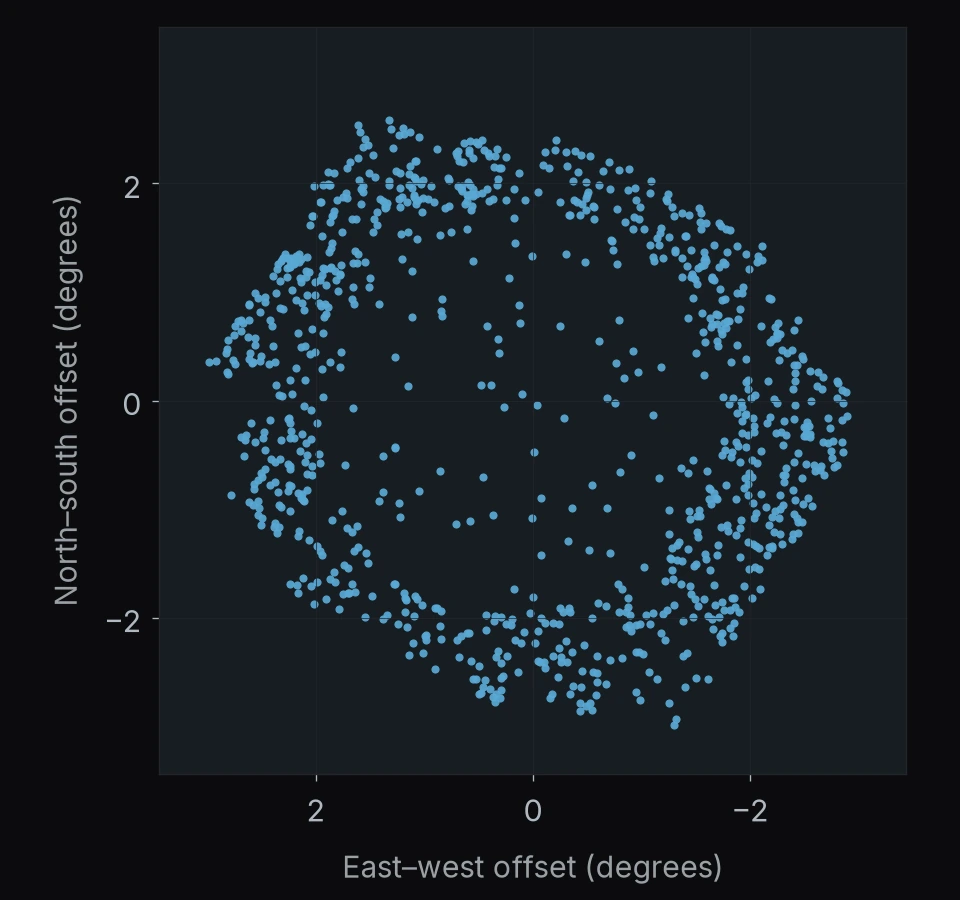
Euclid Deep Field North
971 catalog entries
- Euclid Q1 (Bisigello+25 / Euclid Coll.)971
North is up · east is left.
Axes show angular offsets from the region center.
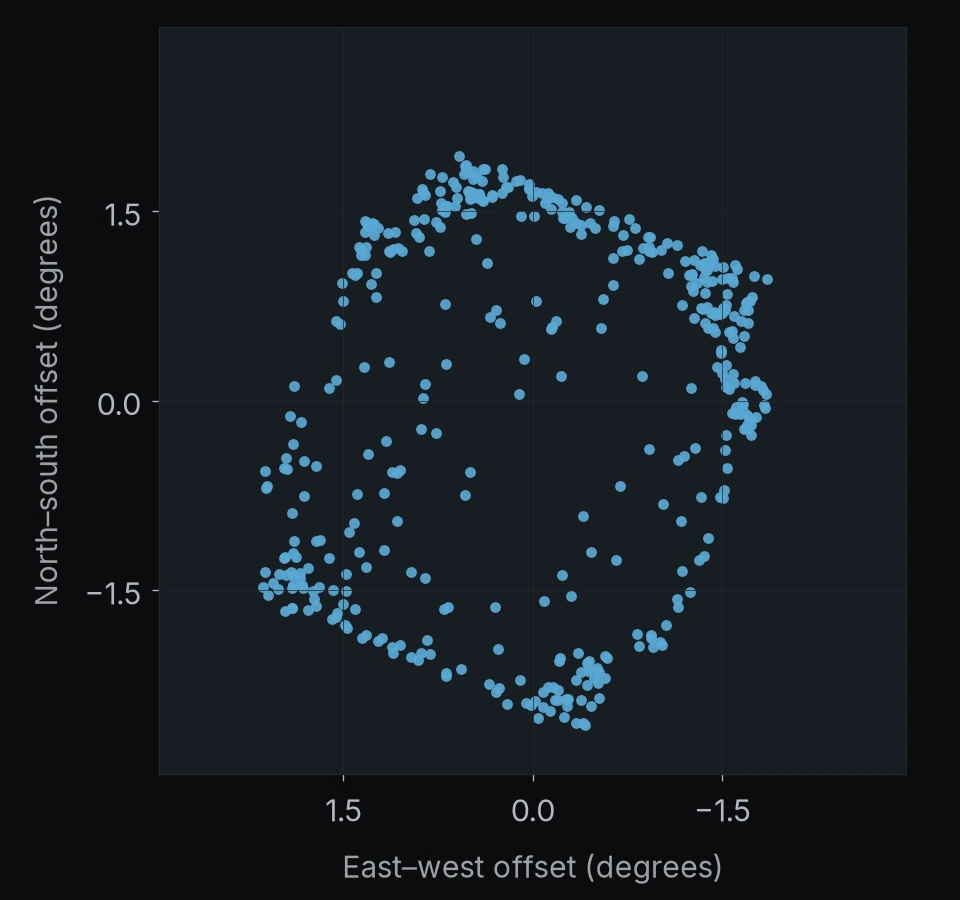
REGION 3 OF 31
Euclid Deep Field Fornax
430 catalog entries
- Euclid Q1 (Bisigello+25 / Euclid Coll.)430
North is up · east is left.
Axes show angular offsets from the region center.
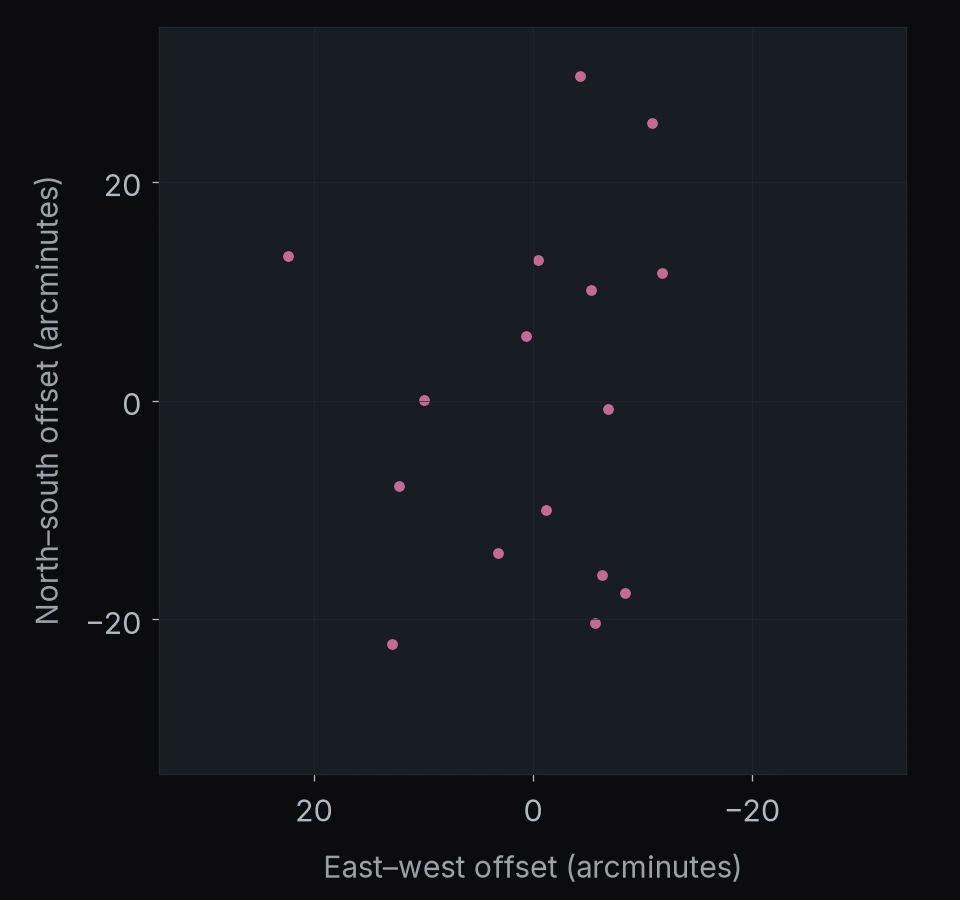
REGION 4 OF 31
COSMOS
16 catalog entries
- Euclid COSMOS z > 4 (Tumborang+26 / Euclid Coll.)16
North is up · east is left.
Axes show angular offsets from the region center.
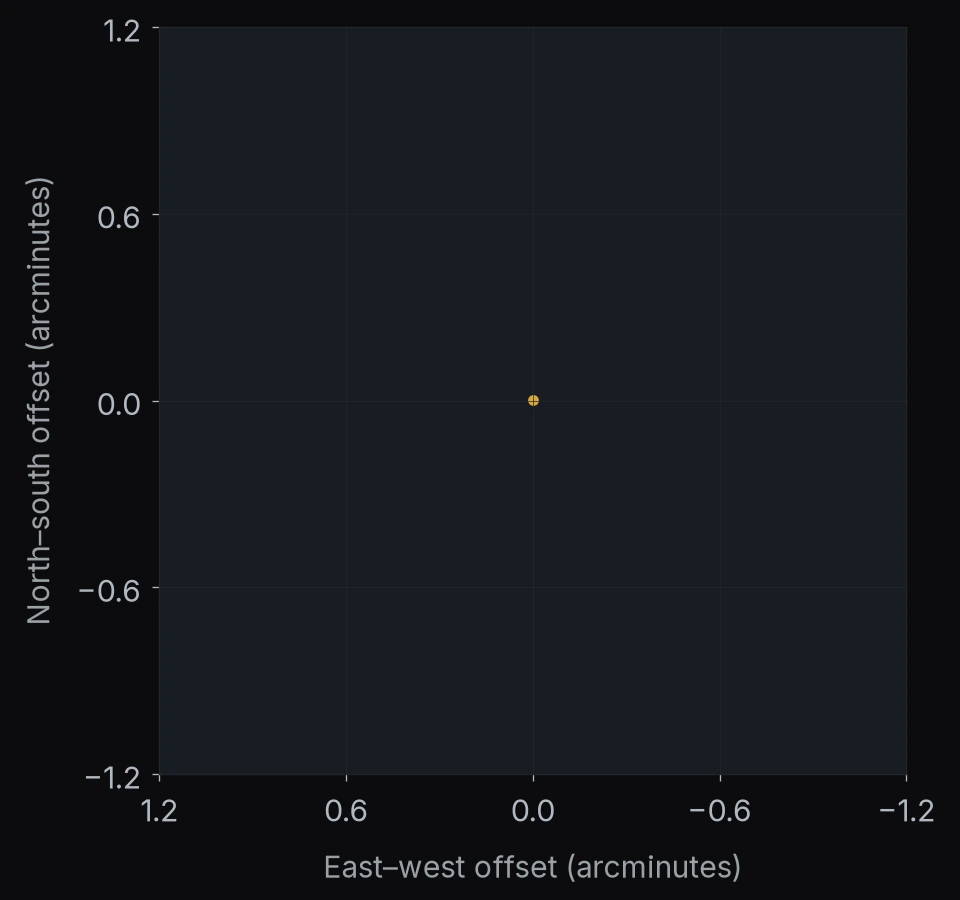
REGION 5 OF 31
RA 287.48° Dec +58.52°
1 catalog entry
- DESI DR1 low-z (Lin+26)1
North is up · east is left.
Axes show angular offsets from the region center.
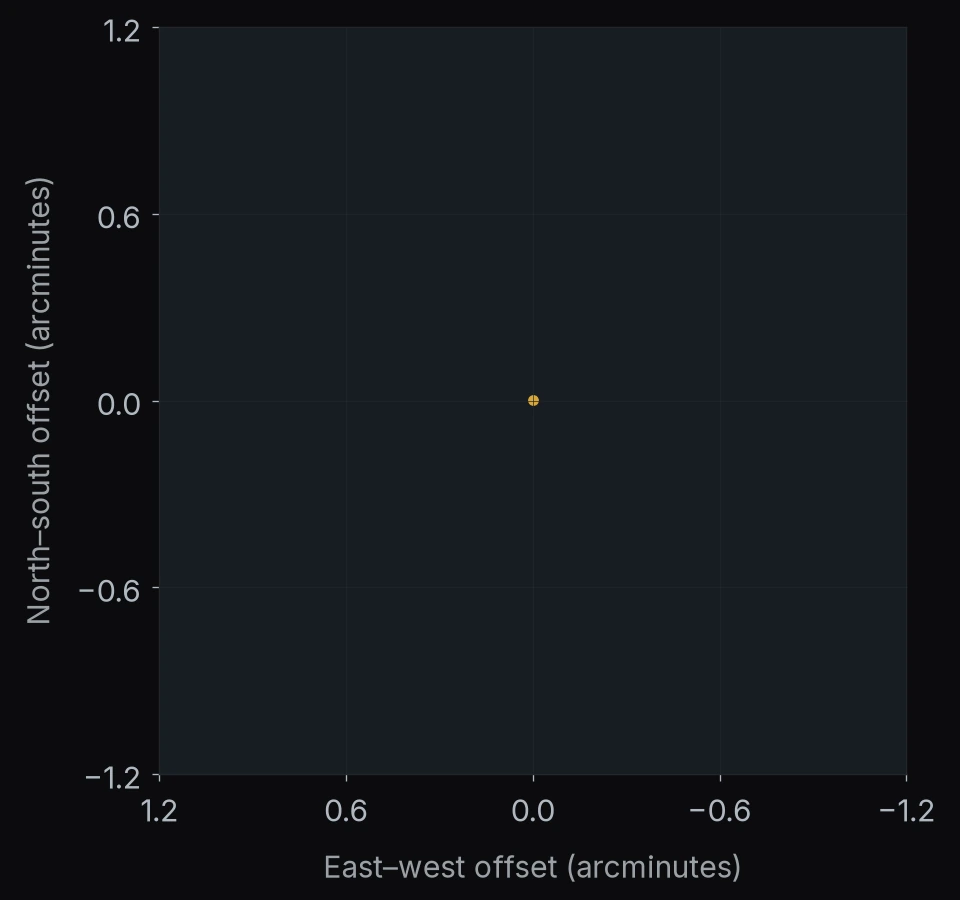
REGION 6 OF 31
RA 245.13° Dec +31.80°
1 catalog entry
- DESI DR1 low-z (Lin+26)1
North is up · east is left.
Axes show angular offsets from the region center.
REGION 7 OF 31
RA 259.42° Dec +38.13°
1 catalog entry
- DESI DR1 low-z (Lin+26)1
North is up · east is left.
Axes show angular offsets from the region center.
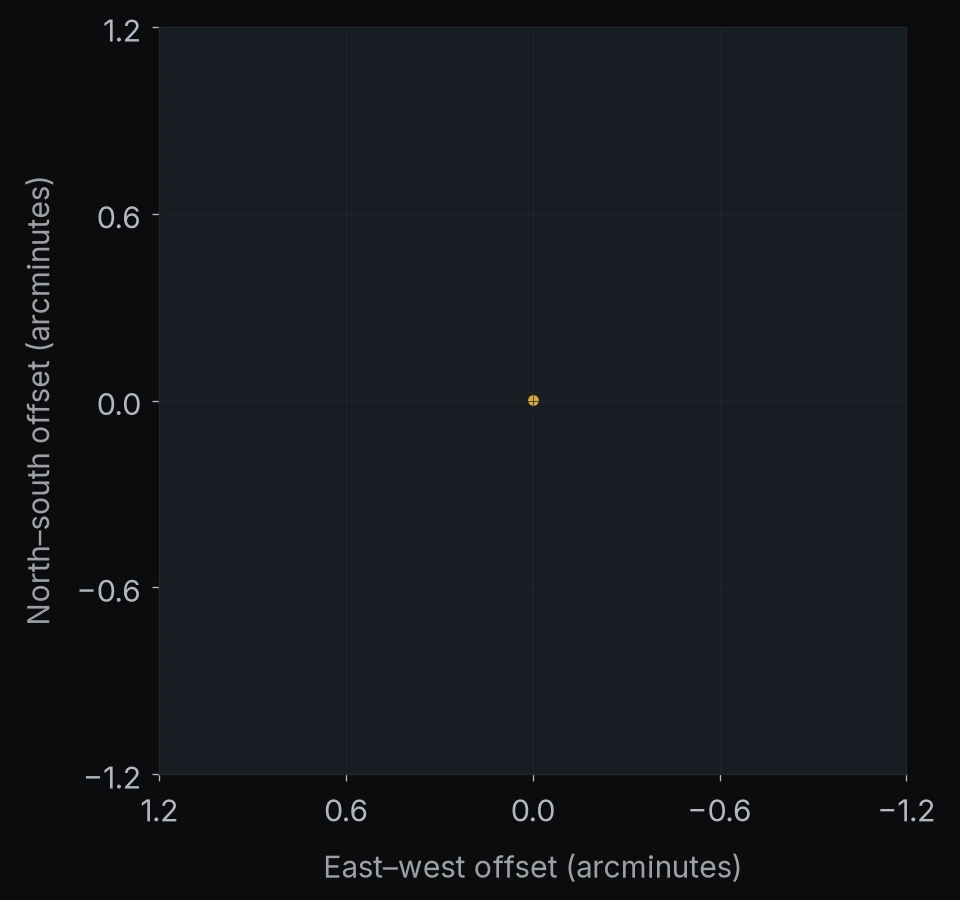
REGION 8 OF 31
RA 250.26° Dec +7.14°
1 catalog entry
- DESI DR1 low-z (Lin+26)1
North is up · east is left.
Axes show angular offsets from the region center.
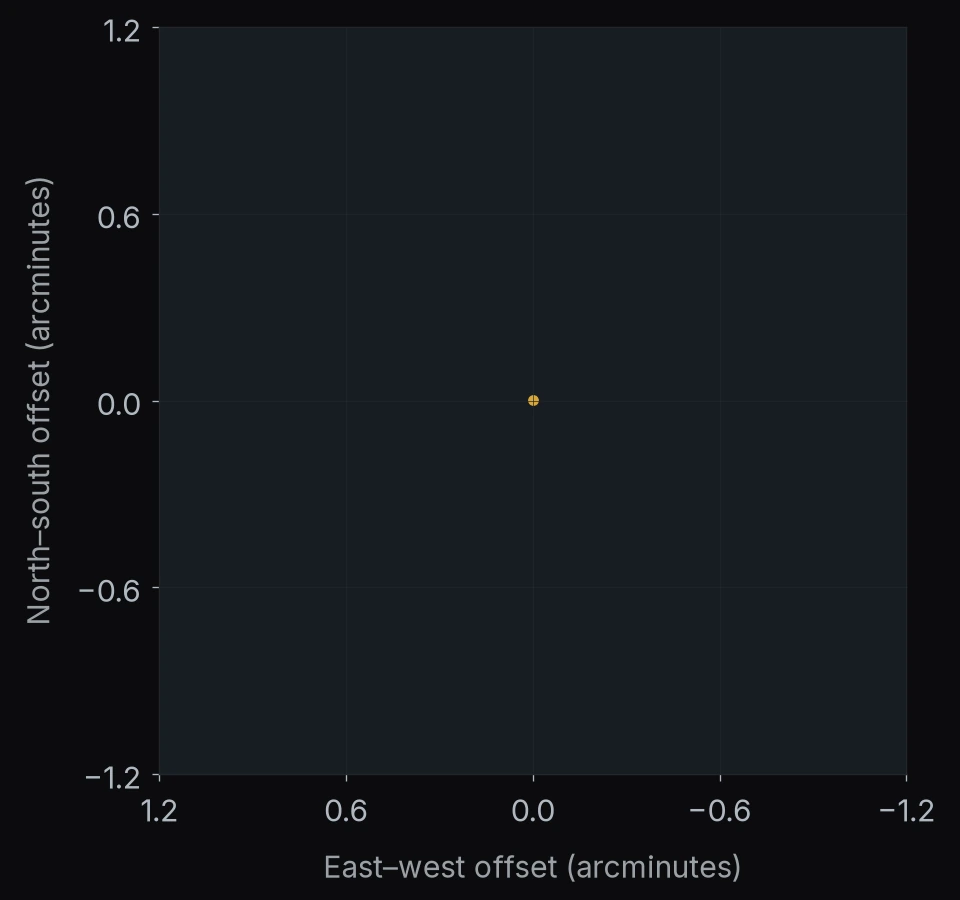
REGION 9 OF 31
RA 250.61° Dec +4.44°
1 catalog entry
- DESI DR1 low-z (Lin+26)1
North is up · east is left.
Axes show angular offsets from the region center.
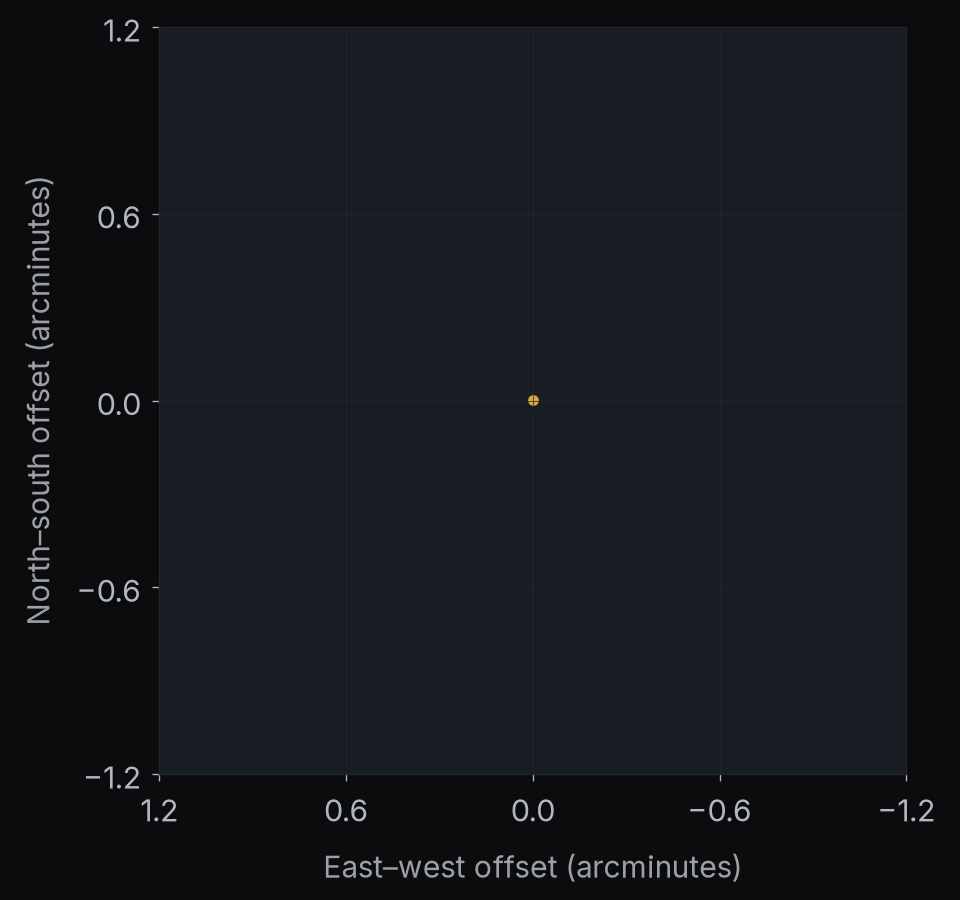
REGION 10 OF 31
RA 253.71° Dec +3.63°
1 catalog entry
- DESI DR1 low-z (Lin+26)1
North is up · east is left.
Axes show angular offsets from the region center.
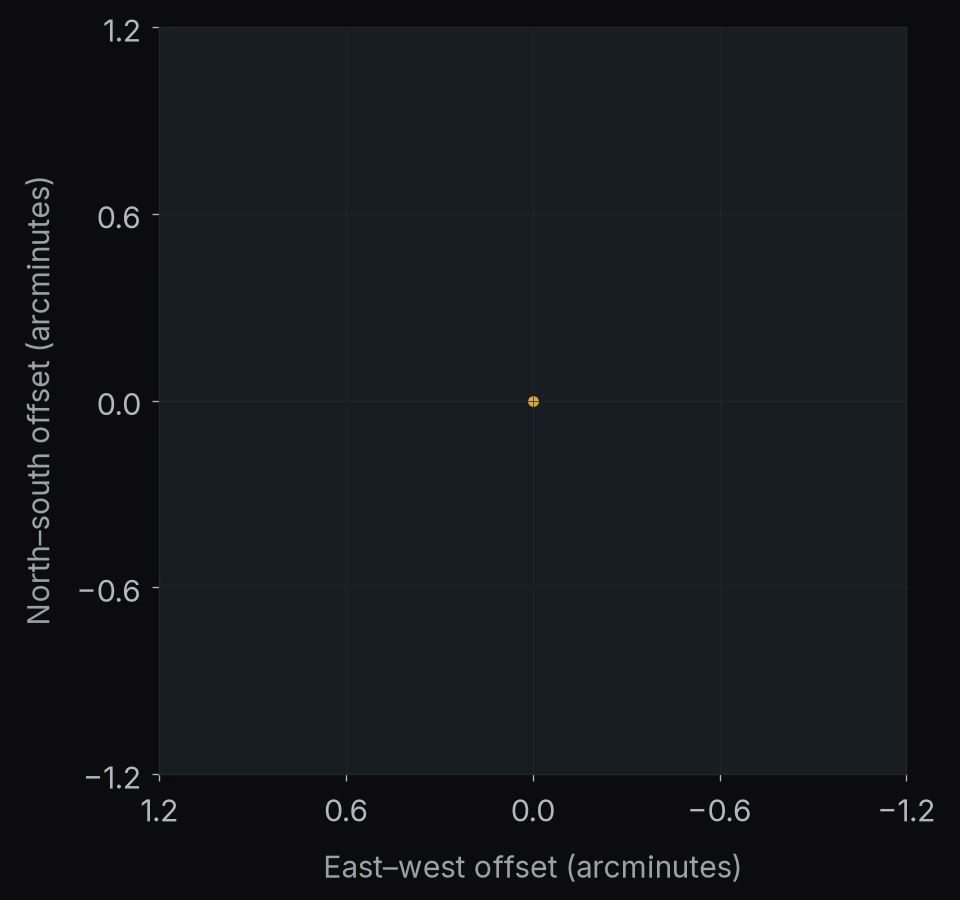
REGION 11 OF 31
RA 251.66° Dec +14.45°
1 catalog entry
- DESI DR1 low-z (Lin+26)1
North is up · east is left.
Axes show angular offsets from the region center.
REGION 12 OF 31
RA 242.76° Dec +9.29°
1 catalog entry
- DESI DR1 low-z (Lin+26)1
North is up · east is left.
Axes show angular offsets from the region center.
REGION 13 OF 31
RA 225.72° Dec +2.84°
1 catalog entry
- DESI DR1 low-z (Lin+26)1
North is up · east is left.
Axes show angular offsets from the region center.
REGION 14 OF 31
RA 200.40° Dec -2.24°
1 catalog entry
- DESI DR1 low-z (Lin+26)1
North is up · east is left.
Axes show angular offsets from the region center.
REGION 15 OF 31
RA 126.53° Dec -1.00°
1 catalog entry
- DESI DR1 low-z (Lin+26)1
North is up · east is left.
Axes show angular offsets from the region center.
REGION 16 OF 31
RA 127.34° Dec +13.21°
1 catalog entry
- DESI DR1 low-z (Lin+26)1
North is up · east is left.
Axes show angular offsets from the region center.
REGION 17 OF 31
RA 146.05° Dec -2.82°
1 catalog entry
- DESI DR1 low-z (Lin+26)1
North is up · east is left.
Axes show angular offsets from the region center.
REGION 18 OF 31
RA 169.93° Dec +2.32°
1 catalog entry
- DESI DR1 low-z (Lin+26)1
North is up · east is left.
Axes show angular offsets from the region center.
REGION 19 OF 31
RA 164.08° Dec +27.90°
1 catalog entry
- DESI DR1 low-z (Lin+26)1
North is up · east is left.
Axes show angular offsets from the region center.
REGION 20 OF 31
RA 164.75° Dec +31.83°
1 catalog entry
- DESI DR1 low-z (Lin+26)1
North is up · east is left.
Axes show angular offsets from the region center.
REGION 21 OF 31
RA 160.68° Dec +37.36°
1 catalog entry
- DESI DR1 low-z (Lin+26)1
North is up · east is left.
Axes show angular offsets from the region center.
REGION 22 OF 31
RA 154.43° Dec +31.25°
1 catalog entry
- DESI DR1 low-z (Lin+26)1
North is up · east is left.
Axes show angular offsets from the region center.
REGION 23 OF 31
RA 156.47° Dec +50.48°
1 catalog entry
- DESI DR1 low-z (Lin+26)1
North is up · east is left.
Axes show angular offsets from the region center.
REGION 24 OF 31
RA 174.39° Dec +55.34°
1 catalog entry
- DESI DR1 low-z (Lin+26)1
North is up · east is left.
Axes show angular offsets from the region center.
REGION 25 OF 31
RA 215.91° Dec +52.04°
1 catalog entry
- DESI DR1 low-z (Lin+26)1
North is up · east is left.
Axes show angular offsets from the region center.
REGION 26 OF 31
RA 205.82° Dec +39.57°
1 catalog entry
- DESI DR1 low-z (Lin+26)1
North is up · east is left.
Axes show angular offsets from the region center.
REGION 27 OF 31
RA 22.38° Dec +6.48°
1 catalog entry
- DESI DR1 low-z (Lin+26)1
North is up · east is left.
Axes show angular offsets from the region center.
REGION 28 OF 31
RA 40.91° Dec +3.82°
1 catalog entry
- DESI DR1 low-z (Lin+26)1
North is up · east is left.
Axes show angular offsets from the region center.
REGION 29 OF 31
RA 343.90° Dec +15.70°
1 catalog entry
- DESI DR1 low-z (Lin+26)1
North is up · east is left.
Axes show angular offsets from the region center.
REGION 30 OF 31
RA 2.36° Dec +8.19°
1 catalog entry
- DESI DR1 low-z (Lin+26)1
North is up · east is left.
Axes show angular offsets from the region center.
REGION 31 OF 31
RA 321.86° Dec -4.80°
1 catalog entry
- DESI DR1 low-z (Lin+26)1
North is up · east is left.
Axes show angular offsets from the region center.
Open the complete sky-map poster ↗High-resolution figure · sources and counting methods included

How these samples compare with JWST
The combined sample contains 3,384 entries and distinct objects: 3,341 Euclid Q1 candidates, 16 Euclid COSMOS candidates and 27 DESI objects, spanning redshifts 0.20–5.15. The median redshift is 1.70 for Euclid Q1, 4.69 for Euclid COSMOS and 0.47 for DESI.
Different depths, sky areas, redshift ranges and selection rules prevent a direct abundance comparison with JWST. Euclid Q1 covers 63 square degrees; the combined source map is not a survey footprint.
No published JWST source in these tables falls within five arcseconds of a non-JWST source; the nearest pair is about 17 arcseconds apart. This alone does not establish that the populations are physically different. Most reported JWST redshifts are photometric estimates.
A central deficit that still needs explaining
Using the published Q1 region areas, North has 7.9 candidates per square degree inside 1.6° of its center and 58.9 outside; Fornax has 7.7 versus 78.5; South has 48.9 versus 74.3. Parent-catalog detections are much flatter across those boundaries. This suggests a selection effect worth investigating, but does not identify its cause. The centers should not be interpreted as empty sky.
MoM-BH*-1, close up
MoM-BH*-1 shows us light from when the universe was 664 million years old. A black hole inside a glowing atmosphere is one interpretation of its spectrum.
 Play narrated film
Read the film transcript
JWST recorded this light when the universe was six hundred sixty-four million years old. The same patch of sky, band by band. Barely there in the blue. In the red, a point.
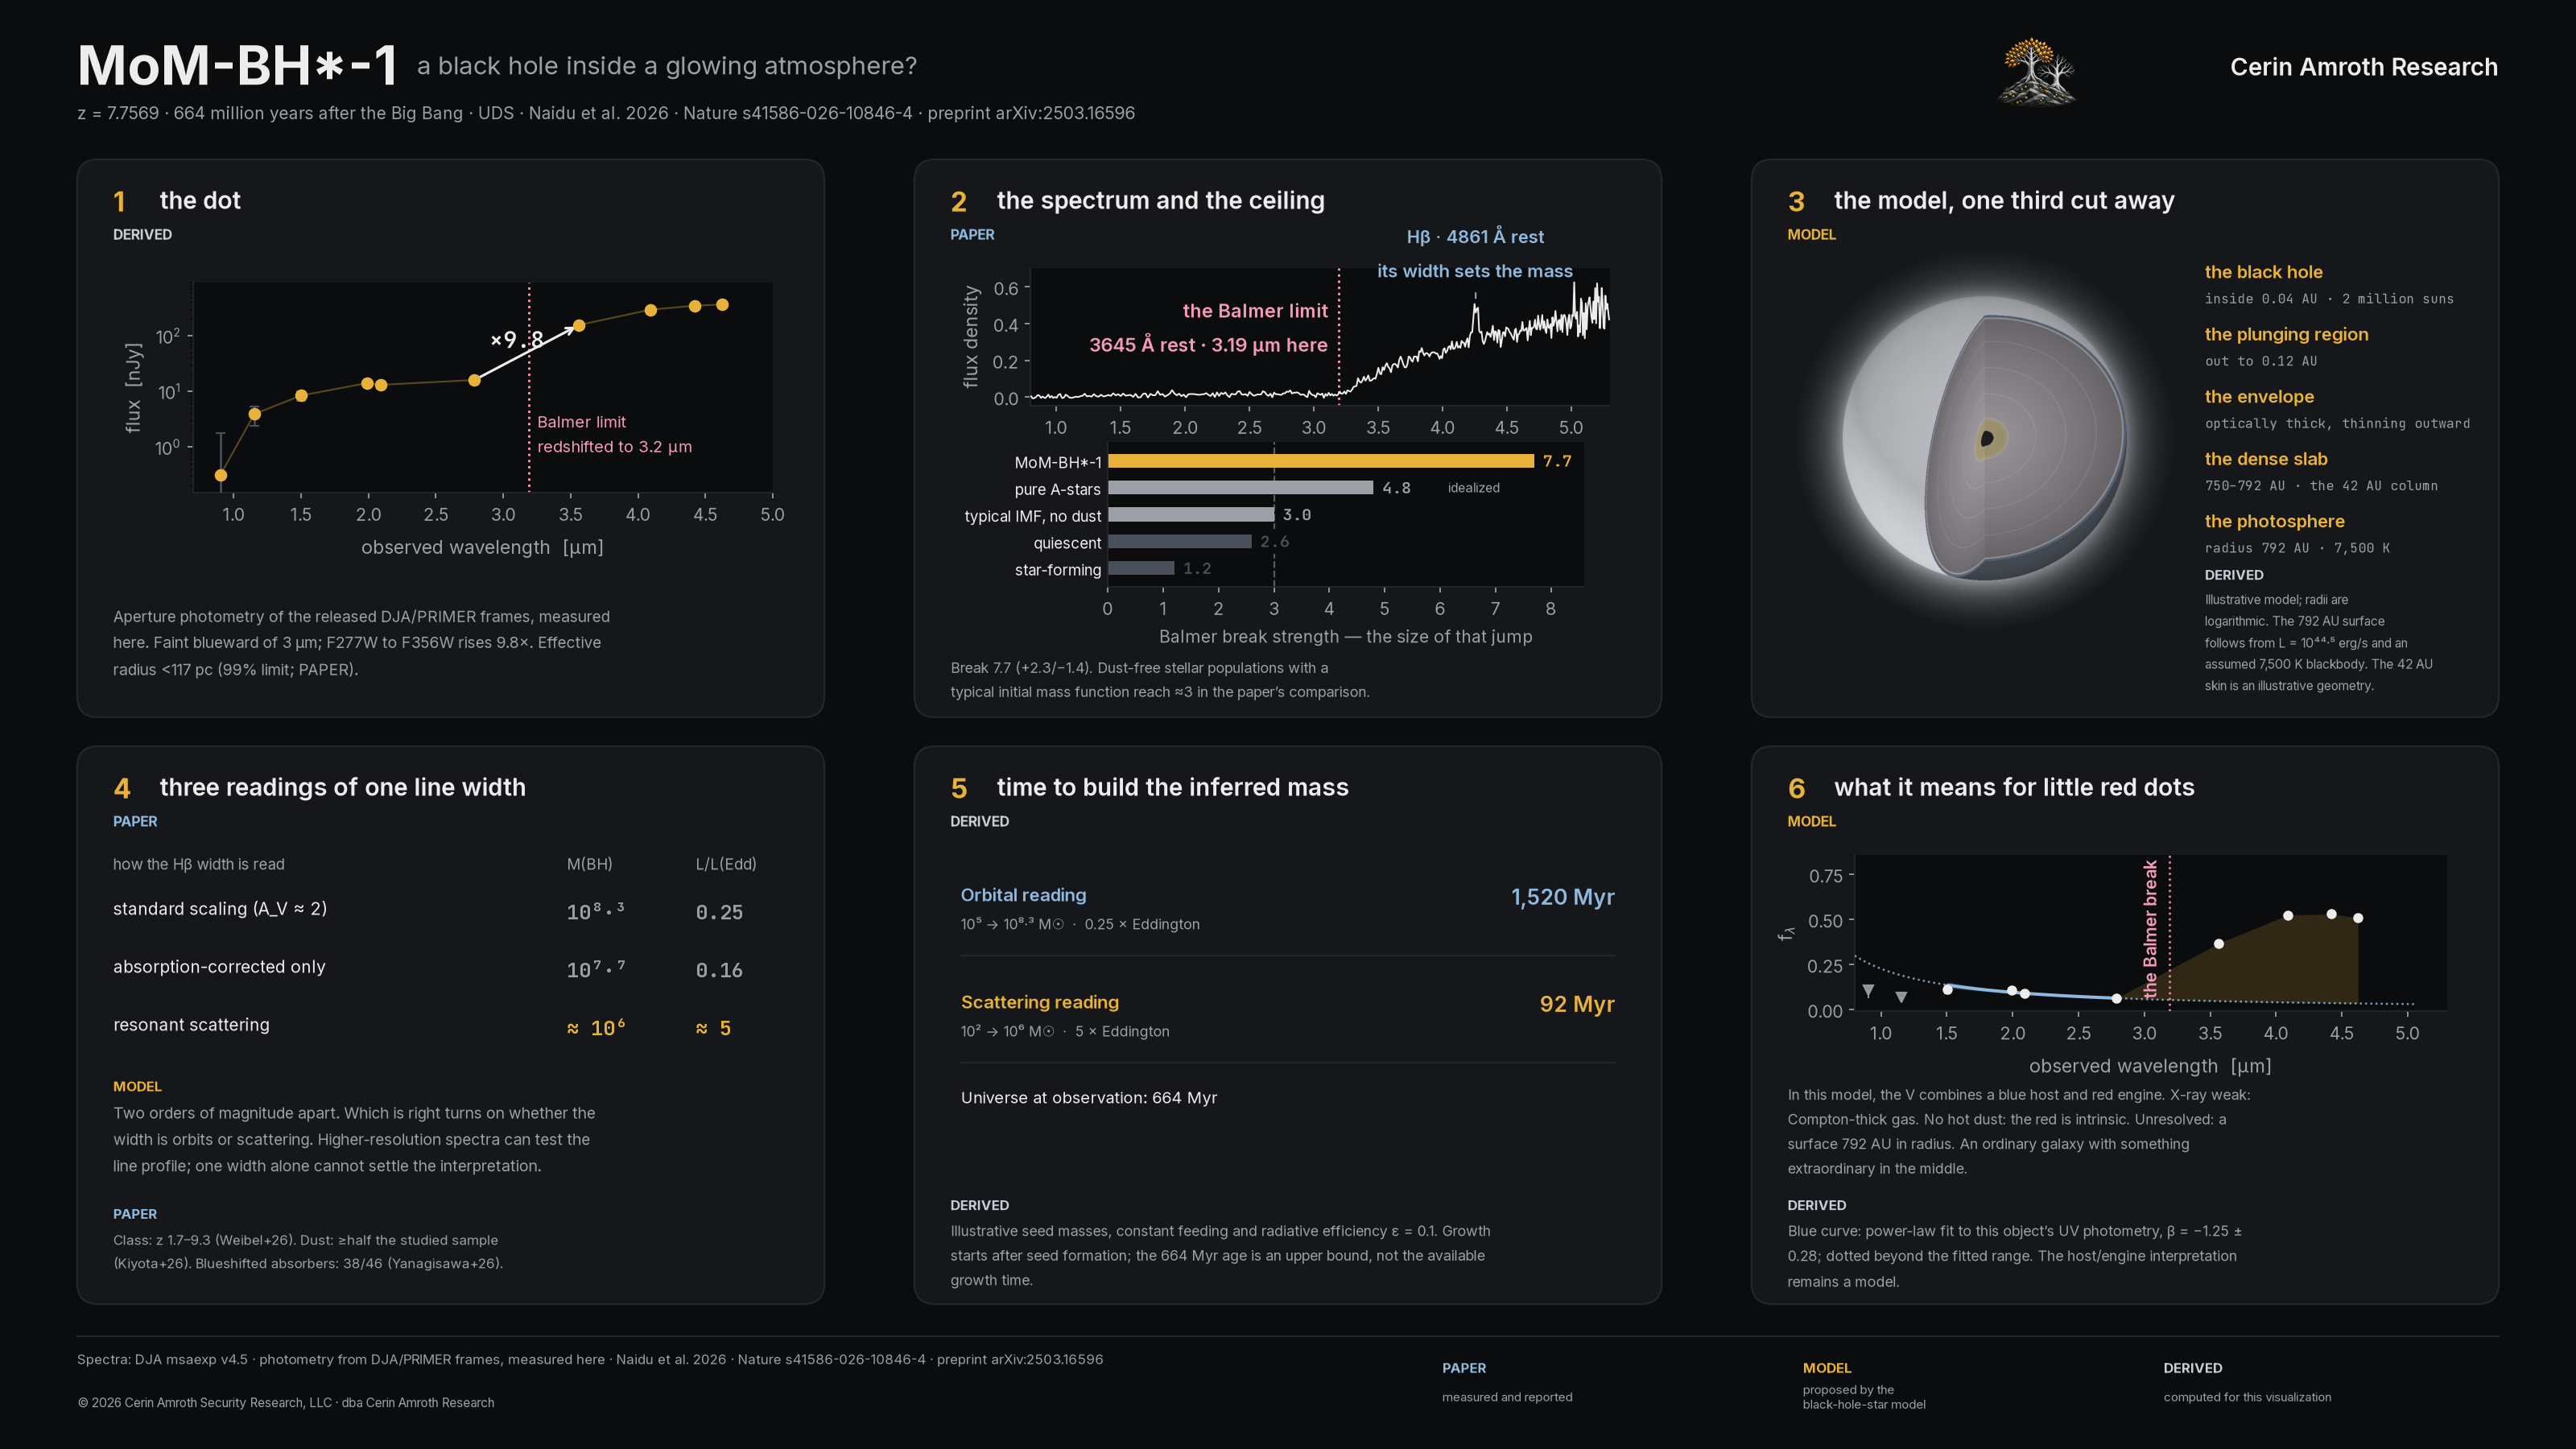
Ten filters, laid out by wavelength. Each point is how much light arrives in one filter. Together they trace the object's color across the infrared. Faint blue light, then a sharp rise into the red. Between these two bands, the flux jumps nearly tenfold.
A spectrum now, instead of ten samples of one. Every wavelength, in order. Hydrogen absorbs hard at one particular wavelength, but only when its electrons are already excited. That takes dense, warm gas. Stars can make a break, but the stellar templates compared here do not make one this large.
Here is what the model puts inside. At the center, a black hole of about two million solar masses, swallowing gas. Around it, the last orbit gas can hold before it falls. Then a dense envelope of gas surrounds the center. Light escapes only at the photosphere, where the gas finally thins. Everything beneath it is inference.
Consider a photon trying to escape through a layer of ionized gas. In this example, free electrons scatter it again and again. Forty-two optical depths imply about seventeen hundred scatterings. Across this model's skin: six hours in a straight line, about ten days by diffusion. Different routes spread out the arrival times. The delay depends on the layer's thickness and the assumed geometry.
So how heavy is it? That turns on one number: the width of a hydrogen line. There it is, on the same spectrum. About three thousand kilometers a second. Line widths can trace motion. Read this one as orbits, and the estimate is two hundred million suns. Resonant scattering by hydrogen offers another way to broaden that line. Then it is around a million instead, running five times past its Eddington limit.
Start with a seed, and grow it to the mass inferred at the time we observe it. The heavy example takes one and a half billion years. The universe here is only six hundred sixty-four million. The lighter example takes ninety-two million years. Both assume a seed mass, steady feeding, and a fixed efficiency. Change those assumptions and the times change. The clock constrains a growth history; it does not choose the model.
If that is what this one is, it may be what a whole population is. Little red dots present several puzzles. This model offers a possible connection between their spectrum, size and weak X-rays. Extending the fitted blue spectrum into the red leaves an excess. Calling that excess an engine is the model. That is one possible reading.
Explore the six-panel science figure
The model’s size, mass and growth
At redshift 7.7569, we see this object when the universe was 664 million years old (Planck18 cosmology). An illustrative blackbody at an assumed 7,500 K has a radius of about 792 AU, or a diameter of about 1,600 AU, for the model luminosity of 10^44.5 erg/s. This is a model scale, far below the image resolution.
One line width, different mass estimates
The published Nature paper explores how the line width changes the inferred mass. Standard orbital scaling gives about 10^8.3 solar masses; omitting the dust correction gives about 10^7.7. The resonant Balmer-scattering interpretation gives about 10^6. These are alternative, model-dependent readings, not three independent mass measurements (published Extended Data Table 4; Table ED 5 in the earlier preprint).
Which luminosity? The Moon and size comparisons use the integrated atmosphere-model luminosity, 10^44.5 erg/s. The paper’s Extended Data Table 4 gives different, Hβ-based estimates: log luminosity 45.7 with dust correction (quoted Eddington ratio 0.25), 45.0 without it (0.16), and approximately 45 for the scattering example (approximately 5). These are alternative assumptions with rounded estimates.
For a direct check, use LEdd = 1.26 × 10^38 × (M / M☉) erg/s. Holding the atmosphere luminosity fixed gives L / LEdd ≈ 0.013 at 10^8.3 solar masses, or 2.5 at 10^6. The growth examples below instead use the paper’s quoted ratios; they are illustrative histories, not ratios calculated from the Moon comparison. The rounded table entries do not give exact ratios when divided.
The growth comparison must build each inferred mass before the observation. With radiative efficiency 0.1 and constant feeding, a 10^5-solar-mass seed takes about 1.52 billion years to reach 10^8.3 at 0.25 times Eddington. A 10^2-solar-mass seed takes about 92 million years to reach 10^6 at five times Eddington. These examples depend on the seed, efficiency and feeding history; seed formation also uses part of the universe’s first 664 million years.
What it could mean for other little red dots
The blue curve in the last panel is fitted to this object’s ultraviolet photometry: β = −1.25 ± 0.28. Dotted segments extrapolate that fit. Interpreting the blue light as a host galaxy and the red excess as a central engine is a model, rather than a measured decomposition.
Selection matters. Rinaldi et al. identify 412 sources across redshift 2–11; extreme color cuts recover about a quarter or less of that candidate sample. Weibel et al. identify 241 black-hole-star candidates spanning redshift 1.7–9.3, an interval of about 3.3 billion years in cosmic time.
The wider class need not share one explanation. Kiyota et al. find evidence for dust in at least about half their studied sample. Yanagisawa et al. report blueshifts in 38 of 46 Balmer absorbers. Higher-resolution line profiles can test the atmospheric interpretation.
If central-engine light is fitted as starlight, inferred stellar masses can be biased upward. That possibility alone does not resolve the abundance of massive galaxies at early times.
References
Reference papers & image archives
- JWST positions: the twelve source catalogs below. Their original selections are retained.
- Euclid: Bisigello et al., Q1 LRD sample, A&A 711, A24, via VizieR J/A+A/711/A24; Tumborang et al., COSMOS sample, the 16 LRD/LBD candidates in Table 3. DESI: Lin et al., DR1 catalog.
- MoM-BH*-1: Naidu et al., Nature (2026) · preprint. Spectra: Dawn JWST Archive; aperture photometry measured from released DJA/PRIMER frames.
The twelve catalogs behind the published map
The map uses the releases listed here. Entries can repeat the same object; paper revisions and later catalog releases may have different totals. Year labels follow the catalog labels; these may use the preprint or journal-publication year.
| Paper | Map entries | Source table |
|---|---|---|
| Akins et al. (2024) | 434 | Table 1, extended machine-readable catalog |
| Kocevski et al. (2024) | 341 | Table 3 |
| Kokorev et al. (2024) | 260 | Online catalog, lrd_table_v1.1.fits |
| Leung et al. (2024) | 100 | Table 2, full machine-readable catalog The released table contains 100 rows; the abstract describes a 95-object sample. The map uses the released table. |
| Rinaldi et al. (2024) | 99 | Table 1, GOODS-field photometric sample |
| de Graaff et al. (2025) | 134 | DJA/NIRSpec catalog v0.1; Appendix A, Table 2 in the original paper This release contains 134 entries for 116 unique sources, including duplicate observations or images. Later paper and catalog revisions are not this map input. |
| Barro et al. (2025) | 118 | Barro25_LRD_NIRSpec_bestfit_properties.fits |
| Weibel et al. (2026) | 241 | BH*-dominated photometric sample catalog v0.1 |
| Matthee et al. (2026) | 18 | Table 1, broad Hα emitter sample |
| Barro et al. (2026) | 189 | Journal Tables 1 and 2 The map includes the 189 MIRI-detected sources with published positions, not all 248 sources described in the paper. |
| Labbé et al. (2025) | 35 | Journal Table 2 The released Table 2 contains 35 rows, including three lensed images of A2744-QSO1; the one-arcsecond positional count does not merge widely separated lensed images. |
| Pérez-González et al. (2024) | 31 | Journal Tables 1 and 2 Positions from Table 1; redshifts from Table 2. |
Catalog references and input checksums (JSON) · Original nine references checked 13 September 2026; three catalog additions checked 17 September 2026.